Pep Boys 2007 Annual Report Download - page 73
Download and view the complete annual report
Please find page 73 of the 2007 Pep Boys annual report below. You can navigate through the pages in the report by either clicking on the pages listed below, or by using the keyword search tool below to find specific information within the annual report.-
 1
1 -
2
-
3
-
4
-
5
-
6
-
7
-
8
-
9
-
10
-
11
-
12
-
13
-
14
-
15
-
16
-
17
-
18
-
19
-
20
-
21
-
22
-
23
-
24
-
25
-
26
-
27
-
28
-
29
-
30
-
31
-
32
-
33
-
34
-
35
-
36
-
37
-
38
-
39
-
40
-
41
-
42
-
43
-
44
-
45
-
46
-
47
-
48
-
49
-
50
-
51
-
52
-
53
-
54
-
55
-
56
-
57
-
58
-
59
-
60
-
61
-
62
-
 63
63 -
 64
64 -
 65
65 -
 66
66 -
 67
67 -
 68
68 -
 69
69 -
 70
70 -
 71
71 -
 72
72 -
 73
73 -
 74
74 -
 75
75 -
 76
76 -
 77
77 -
 78
78 -
 79
79 -
 80
80 -
 81
81 -
 82
82 -
 83
83 -
84
-
85
-
86
-
87
-
88
-
89
-
90
-
91
-
92
-
93
-
94
-
95
-
96
-
97
-
98
-
99
-
100
-
101
-
102
-
103
-
104
-
105
-
106
-
107
-
108
-
109
-
110
-
111
-
112
-
113
-
114
-
115
-
116
-
117
-
118
-
119
-
120
-
121
-
122
-
123
-
124
-
125
-
126
-
127
-
128
-
129
-
130
-
131
-
132
-
133
-
134
-
135
-
136
-
137
-
138
-
139
-
140
-
141
-
142
-
143
-
144
-
145
-
146
-
147
-
148
 |
 |

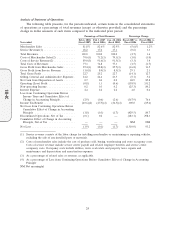
Gross profit from service revenue increased in fiscal 2006 as compared to fiscal 2005. The increase
in dollars was $728,000 or a 2.3% increase from the prior year. This increase as a percentage of service
revenue was primarily due to lower workers compensation expense and repairs and maintenance costs
offset by cost associated with providing free or discounted towing services to our customers.
Net gain from disposition of assets increased, as percentage of total revenue to 0.4% from 0.2% in
fiscal 2005. The $4,142,000 increase resulted from the sale of one owned property and the leasehold
interest in another in 2006 versus the sale of one owned property in 2005.
Selling, general and administrative expenses increased, as a percentage of total revenues, to 24.4%
in fiscal 2006 from 23.5% in fiscal 2005. This was a $26,799,000 or 5.2% increase over the prior year.
This increase, as a percentage of total revenues, was due primarily to higher net media expense offset
by reduced general office expense. The increase in net media expense was caused by a change in our
vendor agreements which resulted in a different application of EITF 02-16, whereby approximately
$35,700,000 in vendor support funds were recorded as a reduction to advertising cost in fiscal 2005 (see
above explanation of vendor agreement restructuring). General office expense was favorable by
$5,007,000 primarily due to incurring a $4,200,000 software impairment charge in fiscal 2005.
Interest expense increased $302,000 to $49,342,000 in fiscal 2006 from fiscal 2005. Included in
fiscal 2006 was $4,200,000 of costs associated with the early satisfaction and discharge of $119,000,000
4% Senior Convertible Notes due in June, 2007 and in fiscal 2005, $9,738,000 in interest and fees
associated with the early satisfaction and discharge of our $43,000,000 6.88% Medium Term Notes and
$100,000,000 6.92% Term Enhanced Remarketable Securities (TERMS). Also in fiscal 2006, we
incurred a higher weighted average interest rate, offset by lower debt levels and a reduction to interest
expense for the increase in the fair value of the interest rate swap of $1,490,000.
Non-operating income increased as a percentage of total revenues from 0.2% in 2005 to 0.3% in
2006. This 80.2% increase of $3,126,000 was a result of interest earned on the investment of funds used
for the early satisfaction and discharge of the Senior Convertible Notes.
Our income tax benefit as a percentage of loss from continuing operations before income taxes
and cumulative effect of change in accounting principle increased to 47.5% or $6,399,000 versus 36.5%
or $21,027,000. The increase in the effective rate is due to a non-cash adjustment of $2,451,000 to our
state deferred liabilities resulting from a change in our filing position.
Gain from discontinued operations increased from $1,088,000, net of tax, in fiscal 2005 to
$4,333,000, net of tax, in fiscal 2006 due primarily to the sale of an owned property.
Net loss decreased in dollars and as a percentage of total revenues, due primarily to an increase in
gross profit from merchandise sales as a percentage of merchandise sales, an increase in gain on
disposition of assets, increase in non-operating income offset by higher selling, general and
administrative expenses.
27
10-K