Pep Boys 2007 Annual Report Download - page 28
Download and view the complete annual report
Please find page 28 of the 2007 Pep Boys annual report below. You can navigate through the pages in the report by either clicking on the pages listed below, or by using the keyword search tool below to find specific information within the annual report.-
 1
1 -
2
-
3
-
4
-
5
-
6
-
7
-
8
-
9
-
10
-
11
-
12
-
13
-
14
-
15
-
16
-
17
-
 18
18 -
 19
19 -
 20
20 -
 21
21 -
 22
22 -
 23
23 -
 24
24 -
 25
25 -
 26
26 -
 27
27 -
 28
28 -
 29
29 -
 30
30 -
 31
31 -
 32
32 -
 33
33 -
 34
34 -
 35
35 -
 36
36 -
 37
37 -
 38
38 -
39
-
40
-
41
-
42
-
43
-
44
-
45
-
46
-
47
-
48
-
49
-
50
-
51
-
52
-
53
-
54
-
55
-
56
-
57
-
58
-
59
-
60
-
61
-
62
-
63
-
64
-
65
-
66
-
67
-
68
-
69
-
70
-
71
-
72
-
73
-
74
-
75
-
76
-
77
-
78
-
79
-
80
-
81
-
82
-
83
-
84
-
85
-
86
-
87
-
88
-
89
-
90
-
91
-
92
-
93
-
94
-
95
-
96
-
97
-
98
-
99
-
100
-
101
-
102
-
103
-
104
-
105
-
106
-
107
-
108
-
109
-
110
-
111
-
112
-
113
-
114
-
115
-
116
-
117
-
118
-
119
-
120
-
121
-
122
-
123
-
124
-
125
-
126
-
127
-
128
-
129
-
130
-
131
-
132
-
133
-
134
-
135
-
136
-
137
-
138
-
139
-
140
-
141
-
142
-
143
-
144
-
145
-
146
-
147
-
148
 |
 |

20
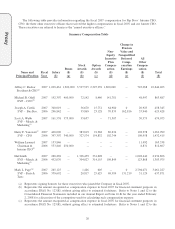
The following table provides information regarding the fiscal 2007 compensation for Pep Boys’ Interim CEO,
CFO, the three other executive officers that received the highest compensation in fiscal 2007 and our former CEO.
These executives are referred to herein as the “named executive officers.”
Summary Compensation Table
Name and
Principal Position
Fiscal
Year
Salary
($)
Bonus
($)
(a)
Stock
Awards
($)
(b)
Option
Awards
($)
(c)
Non-
Equity
Incentive
Plan
Compen-
sation
($)
(d)
Change in
Pension
Value and
Nonqualified
Deferred
Comp-
ensation
Earnings
($)
(e)
All
Other
Compen-
sation
($)
(f)
Total
($)
Jeffrey C. Rachor 2007 1,038,461
1,200,000
3,537,535 2,325,339
1,800,000 -- 743,068 10,644,403
President & CEO(g)
Michael R. Odell 2007 192,307
400,000
72,142 8,460
141,781 -- 48,997 863,687
EVP – COO(h)
Joseph A. Cirelli 2007 300,019
-- 56,670 15,751
64,980 0 20,925 458,345
SVP – Bus.Dev. 2006 296,842
-- 35,869 23,128
70,833 162,816 33,940 623,428
Scott A. Webb 2007 161,538
375,000
35,657 --
71,507 -- 30,373 674,075
SVP – Merch. &
Marketing(i)
Harry F. Yanowitz(j) 2007 400,000
-- 383,819 91,268
86,634 -- 102,278 1,063,999
SVP - CFO 2006 397,307
340,000
327,574 154,832
102,744 -- 109,958 1,432,415
William Leonard 2007 153,846
-- -- --
-- -- 11,492 165,338
Chairman &
Interim CEO(k) 2006 553,846
250,000
-- --
-- -- 8,831 812,667
Hal Smith 2007 268,269
-- 1,306,459 331,698
-- -- 1,028,440 2,934,866
EVP – Merch. &
Marketing(l) 2006 452,076
-- 304,027 314,155
109,849 -- 123,868 1,303,975
Mark L. Page(m) 2007 265,125
-- 1,426 605
-- 0 2,794,071 3,061,227
SVP – Parts &
Tires 2006 359,692
-- 20,817 25,625
69,389 131,219 31,129 637,871
(a) Represents signing bonuses for those executives who joined the Company in fiscal 2007.
(b) Represents the amount recognized as compensation expense in fiscal 2007 for financial statement purposes in
accordance SFAS No. 123(R), without giving effect to estimated forfeitures. Refer to Notes 1 and 12 to the
Consolidated Financial Statements included in our Annual Report on Form 10-K for the year ended February
2, 2008 for a discussion of the assumptions used for calculating such compensation expense.
(c) Represents the amount recognized as compensation expense in fiscal 2007 for financial statement purposes in
accordance SFAS No. 123(R), without giving effect to estimated forfeitures. Refer to Notes 1 and 12 to the
Proxy