Pep Boys 2007 Annual Report Download - page 119
Download and view the complete annual report
Please find page 119 of the 2007 Pep Boys annual report below. You can navigate through the pages in the report by either clicking on the pages listed below, or by using the keyword search tool below to find specific information within the annual report.-
 1
1 -
2
-
3
-
4
-
5
-
6
-
7
-
8
-
9
-
10
-
11
-
12
-
13
-
14
-
15
-
16
-
17
-
18
-
19
-
20
-
21
-
22
-
23
-
24
-
25
-
26
-
27
-
28
-
29
-
30
-
31
-
32
-
33
-
34
-
35
-
36
-
37
-
38
-
39
-
40
-
41
-
42
-
43
-
44
-
45
-
46
-
47
-
48
-
49
-
50
-
51
-
52
-
53
-
54
-
55
-
56
-
57
-
58
-
59
-
60
-
61
-
62
-
63
-
64
-
65
-
66
-
67
-
68
-
69
-
70
-
71
-
72
-
73
-
74
-
75
-
76
-
77
-
78
-
79
-
80
-
81
-
82
-
83
-
84
-
85
-
86
-
87
-
88
-
89
-
90
-
91
-
92
-
93
-
94
-
95
-
96
-
97
-
98
-
99
-
100
-
101
-
102
-
103
-
104
-
105
-
106
-
107
-
108
-
 109
109 -
 110
110 -
 111
111 -
 112
112 -
 113
113 -
 114
114 -
 115
115 -
 116
116 -
 117
117 -
 118
118 -
 119
119 -
 120
120 -
 121
121 -
 122
122 -
 123
123 -
 124
124 -
 125
125 -
 126
126 -
 127
127 -
 128
128 -
 129
129 -
130
-
131
-
132
-
133
-
134
-
135
-
136
-
137
-
138
-
139
-
140
-
141
-
142
-
143
-
144
-
145
-
146
-
147
-
148
 |
 |

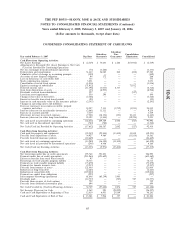
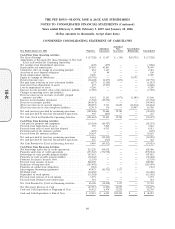
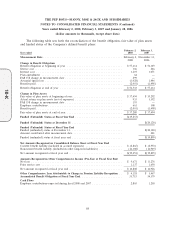
THE PEP BOYS—MANNY, MOE & JACK AND SUBSIDIARIES
NOTES TO CONSOLIDATED FINANCIAL STATEMENTS (Continued)
Years ended February 2, 2008, February 3, 2007 and January 28, 2006
(dollar amounts in thousands, except share data)
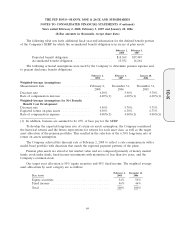
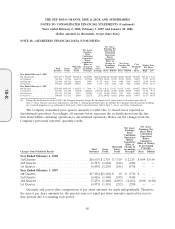
The following table summarizes information about options during the last three fiscal years (dollars
in thousands except per option amount):
Fiscal 2007 Fiscal 2006 Fiscal 2005
Weighted average fair value at grant date per option ..... $ 5.04 $10.04 $ 7.66
Intrinsic value at exercise date ..................... 2,194 370 2,531
The aggregate intrinsic value of outstanding options at February 2, 2008 was $1,244; of which
$1,242 was vested. At February 2, 2008, the weighted average remaining contractual term of
outstanding options and exercisable options is 4.4 years and 3.6 years. At February 2, 2008, the
weighted average remaining contractual term and aggregate intrinsic value of outstanding and expected
to vest options is 4.4 years and $1,244. The cash received and related tax benefit realized from options
exercised during fiscal year 2007 was $3,652 and $815 respectively. At February 2, 2008, there was
approximately $2,835 of total unrecognized pre-tax compensation cost related to non-vested stock
options, which is expected to be recognized over a weighted-average period of 1.1 years.
The following table summarizes information about non-vested stock awards (RSUs) since
February 3, 2007:
Weighted
Number of Average
RSUs Fair Value
Nonvested at February 3, 2007 ............................... 358,786 $15.41
Granted ............................................. 764,529 15.56
Forfeited ............................................. (65,167) 16.77
Vested .............................................. (347,203) 14.89
Nonvested at February 2, 2008 ............................. 710,945 $15.58
The following table summarizes information about RSUs during the last three fiscal years (dollars
in thousands except per unit amount):
Fiscal 2007 Fiscal 2006 Fiscal 2005
Weighted average fair value at grant date per unit ....... $15.56 $13.58 $16.71
Fair value at vesting date ......................... 3,341 1,660 881
Intrinsic value at conversion date ................... 3,773 1,075 679
Tax benefits realized from conversions ................ 1,402 734 248
At February 2, 2008, there was approximately $7,341 of total unrecognized pre-tax compensation
cost related to non-vested RSUs, which is expected to be recognized over a weighted-average period of
3.6 years.
NOTE 13—ASSET RETIREMENT OBLIGATIONS
At February 2, 2008, the Company has a liability pertaining to the asset retirement obligation in
accrued expenses and other long-term liabilities on its consolidated balance sheet. The following is a
73
10-K