Pep Boys 2007 Annual Report Download - page 70
Download and view the complete annual report
Please find page 70 of the 2007 Pep Boys annual report below. You can navigate through the pages in the report by either clicking on the pages listed below, or by using the keyword search tool below to find specific information within the annual report.-
 1
1 -
2
-
3
-
4
-
5
-
6
-
7
-
8
-
9
-
10
-
11
-
12
-
13
-
14
-
15
-
16
-
17
-
18
-
19
-
20
-
21
-
22
-
23
-
24
-
25
-
26
-
27
-
28
-
29
-
30
-
31
-
32
-
33
-
34
-
35
-
36
-
37
-
38
-
39
-
40
-
41
-
42
-
43
-
44
-
45
-
46
-
47
-
48
-
49
-
50
-
51
-
52
-
53
-
54
-
55
-
56
-
57
-
58
-
59
-
 60
60 -
 61
61 -
 62
62 -
 63
63 -
 64
64 -
 65
65 -
 66
66 -
 67
67 -
 68
68 -
 69
69 -
 70
70 -
 71
71 -
 72
72 -
 73
73 -
 74
74 -
 75
75 -
 76
76 -
 77
77 -
 78
78 -
 79
79 -
 80
80 -
81
-
82
-
83
-
84
-
85
-
86
-
87
-
88
-
89
-
90
-
91
-
92
-
93
-
94
-
95
-
96
-
97
-
98
-
99
-
100
-
101
-
102
-
103
-
104
-
105
-
106
-
107
-
108
-
109
-
110
-
111
-
112
-
113
-
114
-
115
-
116
-
117
-
118
-
119
-
120
-
121
-
122
-
123
-
124
-
125
-
126
-
127
-
128
-
129
-
130
-
131
-
132
-
133
-
134
-
135
-
136
-
137
-
138
-
139
-
140
-
141
-
142
-
143
-
144
-
145
-
146
-
147
-
148
 |
 |

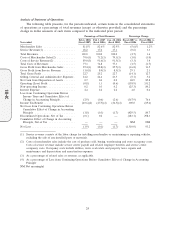
Analysis of Statement of Operations
The following table presents, for the periods indicated, certain items in the consolidated statements
of operations as a percentage of total revenues (except as otherwise provided) and the percentage
change in dollar amounts of such items compared to the indicated prior period.
Percentage of Total Revenues Percentage Change
Feb 2, 2008 Feb 3, 2007 Jan. 28, 2006 Fiscal 2007 vs. Fiscal 2006 vs.
Year ended (fiscal 2007) (fiscal 2006) (fiscal 2005) Fiscal 2006 Fiscal 2005
Merchandise Sales ................... 81.8% 82.6% 82.9% (5.6)% 1.2%
Service Revenue(1) ................... 18.2 17.4 17.1 (0.6) 3.3
Total Revenues ...................... 100.0 100.0 100.0 (4.7) 1.6
Costs of Merchandise Sales(2) ........... 74.6(3) 71.2(3) 74.3(3) (1.0) (3.0)
Costs of Service Revenue(2) ............. 89.0(3) 91.6(3) 91.5(3) (3.3) 3.4
Total Costs of Revenues ............... 77.3 74.8 77.3 (1.5) (1.7)
Gross Profit from Merchandise Sales ....... 25.4(3) 28.8(3) 25.7(3) (16.8) 13.5
Gross Profit from Service Revenue ........ 11.0(3) 8.4(3) 8.5(3) 29.1 2.3
Total Gross Profit .................... 22.7 25.2 22.7 (14.1) 12.7
Selling, General and Administrative Expenses . 24.2 24.4 23.5 (5.1) 5.2
Net Gain from Disposition of Assets ....... 0.7 0.4 0.2 68.9 85.8
Operating (Loss) Profit ................ (0.8) 1.3 (0.6) (158.9) 331.2
Non-operating Income ................. 0.2 0.3 0.2 (25.3) 80.2
Interest Expense ..................... 2.4 2.2 2.2 4.0 0.6
Loss from Continuing Operations Before
Income Taxes and Cumulative Effect of
Change in Accounting Principle ......... (2.9) (0.6) (2.6) (367.9) 76.6
Income Tax Benefit ................... (40.6)(4) (47.5)(4) (36.5)(4) 300.0 (69.6)
Net Loss from Continuing Operations Before
Cumulative Effect of Change in Accounting
Principle ........................ (1.8) (0.3) (1.7) (429.5) 80.7
Discontinued Operations, Net of Tax ....... (0.1) 0.2 — (183.1) 298.3
Cumulative Effect of Change in Accounting
Principle, Net of Tax ................ — — — NM NM
Net Loss .......................... (1.9) (0.1) (1.7) (1,510.0) 93.2
(1) Service revenue consists of the labor charge for installing merchandise or maintaining or repairing vehicles,
excluding the sale of any installed parts or materials.
(2) Costs of merchandise sales include the cost of products sold, buying, warehousing and store occupancy costs.
Costs of service revenue include service center payroll and related employee benefits and service center
occupancy costs. Occupancy costs include utilities, rents, real estate and property taxes, repairs and
maintenance and depreciation and amortization expenses.
(3) As a percentage of related sales or revenue, as applicable.
(4) As a percentage of Loss from Continuing Operations Before Cumulative Effect of Change in Accounting
Principle
NM Not meaningful
24
10-K