Pep Boys 2007 Annual Report Download - page 115
Download and view the complete annual report
Please find page 115 of the 2007 Pep Boys annual report below. You can navigate through the pages in the report by either clicking on the pages listed below, or by using the keyword search tool below to find specific information within the annual report.-
 1
1 -
2
-
3
-
4
-
5
-
6
-
7
-
8
-
9
-
10
-
11
-
12
-
13
-
14
-
15
-
16
-
17
-
18
-
19
-
20
-
21
-
22
-
23
-
24
-
25
-
26
-
27
-
28
-
29
-
30
-
31
-
32
-
33
-
34
-
35
-
36
-
37
-
38
-
39
-
40
-
41
-
42
-
43
-
44
-
45
-
46
-
47
-
48
-
49
-
50
-
51
-
52
-
53
-
54
-
55
-
56
-
57
-
58
-
59
-
60
-
61
-
62
-
63
-
64
-
65
-
66
-
67
-
68
-
69
-
70
-
71
-
72
-
73
-
74
-
75
-
76
-
77
-
78
-
79
-
80
-
81
-
82
-
83
-
84
-
85
-
86
-
87
-
88
-
89
-
90
-
91
-
92
-
93
-
94
-
95
-
96
-
97
-
98
-
99
-
100
-
101
-
102
-
103
-
104
-
 105
105 -
 106
106 -
 107
107 -
 108
108 -
 109
109 -
 110
110 -
 111
111 -
 112
112 -
 113
113 -
 114
114 -
 115
115 -
 116
116 -
 117
117 -
 118
118 -
 119
119 -
 120
120 -
 121
121 -
 122
122 -
 123
123 -
 124
124 -
 125
125 -
126
-
127
-
128
-
129
-
130
-
131
-
132
-
133
-
134
-
135
-
136
-
137
-
138
-
139
-
140
-
141
-
142
-
143
-
144
-
145
-
146
-
147
-
148
 |
 |

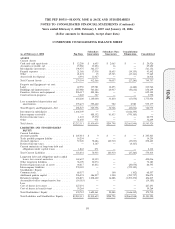
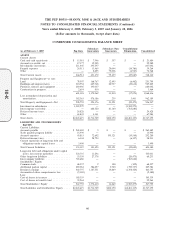
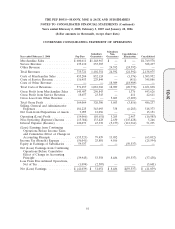
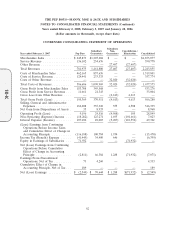
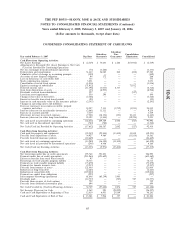
THE PEP BOYS—MANNY, MOE & JACK AND SUBSIDIARIES
NOTES TO CONSOLIDATED FINANCIAL STATEMENTS (Continued)
Years ended February 2, 2008, February 3, 2007 and January 28, 2006
(dollar amounts in thousands, except share data)
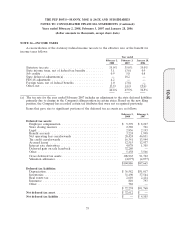
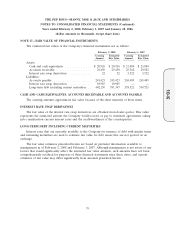
The following table sets forth additional fiscal year-end information for the defined benefit portion
of the Company’s SERP for which the accumulated benefit obligation is in excess of plan assets:
February 2, February 3,
2008 2007
Projected benefit obligation ......................... $18,369 $17,499
Accumulated benefit obligation ...................... 15,552 14,264
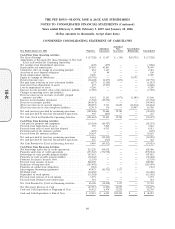
The following actuarial assumptions were used by the Company to determine pension expense and
to present disclosure benefit obligations:
February 2, February 3, January 28,
2008 2007 2006
Weighted-Average Assumptions:
Measurement date ......................... February 2, December 31, December 31,
2008 2006 2005
Discount rate ............................ 6.50% 5.90% 5.70%
Rate of compensation increase ................ 4.00%(1) 4.00%(1) 4.00%(1)
Weighted-Average Assumptions for Net Periodic
Benefit Cost Development:
Discount rate ............................ 5.90% 5.70% 5.75%
Expected return on plan assets ................ 6.30% 6.30% 6.75%
Rate of compensation expense ................ 4.00%(1) 4.00%(1) 4.00%(1)
(1) In addition, bonuses are assumed to be 25% of base pay for the SERP.
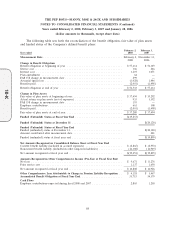
To develop the expected long-term rate of return on assets assumption, the Company considered
the historical returns and the future expectations for returns for each asset class, as well as the target
asset allocation of the pension portfolio. This resulted in the selection of the 6.30% long-term rate of
return on assets assumption.
The Company selected the discount rate at February 2, 2008 to reflect a rate commensurate with a
model bond portfolio with durations that match the expected payment patterns of the plans.
Pension plan assets are stated at fair market value and are composed primarily of money market
funds, stock index funds, fixed income investments with maturities of less than five years, and the
Company’s common stock.
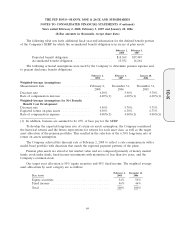
Our target asset allocation is 50% equity securities and 50% fixed income. The weighted average
asset allocations by asset category are as follows:
February 2, December 31,
Plan Assets 2008 2006
Equity securities ................................ 54% 54%
Fixed income .................................. 46% 46%
Total ........................................ 100% 100%
69
10-K