NetSpend 2014 Annual Report Download - page 93
Download and view the complete annual report
Please find page 93 of the 2014 NetSpend annual report below. You can navigate through the pages in the report by either clicking on the pages listed below, or by using the keyword search tool below to find specific information within the annual report.-
 1
1 -
2
-
3
-
4
-
5
-
6
-
7
-
8
-
9
-
10
-
11
-
12
-
13
-
14
-
15
-
16
-
17
-
18
-
19
-
20
-
21
-
22
-
23
-
24
-
25
-
26
-
27
-
28
-
29
-
30
-
31
-
32
-
33
-
34
-
35
-
36
-
37
-
38
-
39
-
40
-
41
-
42
-
43
-
44
-
45
-
46
-
47
-
48
-
49
-
50
-
51
-
52
-
53
-
54
-
55
-
56
-
57
-
58
-
59
-
60
-
61
-
62
-
63
-
64
-
65
-
66
-
67
-
68
-
69
-
70
-
71
-
72
-
73
-
74
-
75
-
76
-
77
-
78
-
79
-
80
-
81
-
82
-
 83
83 -
 84
84 -
 85
85 -
 86
86 -
 87
87 -
 88
88 -
 89
89 -
 90
90 -
 91
91 -
 92
92 -
 93
93 -
 94
94 -
 95
95
 |
 |
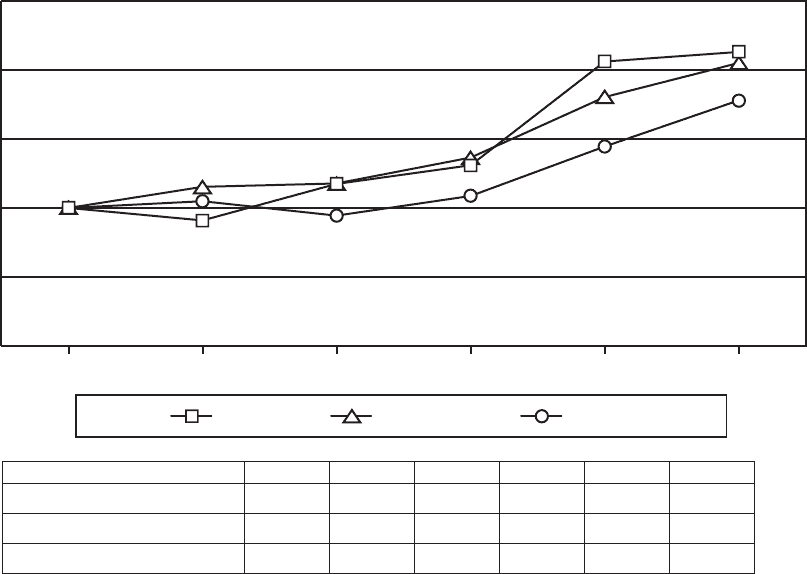
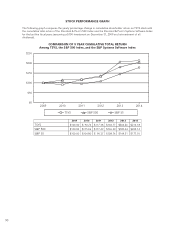
STOCK PERFORMANCE GRAPH
The following graph compares the yearly percentage change in cumulative shareholder return on TSYS stock with
the cumulative total return of the Standard & Poor’s 500 Index and the Standard & Poor’s Systems Software Index
for the last five fiscal years (assuming a $100 investment on December 31, 2009 and reinvestment of all
dividends).
COMPARISON OF 5 YEAR CUMULATIVE TOTAL RETURN
Among TSYS, the S&P 500 Index, and the S&P Systems Software Index
201420132012201120102009
TSYS S&P 500 S&P SS
$0
$50
$100
$150
$200
$250
2009 2010 2011 2012 2013 2014
TSYS $100.00 $ 90.74 $117.38 $130.77 $206.26 $213.18
S&P 500 $100.00 $115.06 $117.49 $136.30 $180.44 $205.14
S&P SS $100.00 $104.80 $ 94.37 $108.74 $144.51 $177.76
90