NetSpend 2014 Annual Report Download - page 10
Download and view the complete annual report
Please find page 10 of the 2014 NetSpend annual report below. You can navigate through the pages in the report by either clicking on the pages listed below, or by using the keyword search tool below to find specific information within the annual report.-
 1
1 -
 2
2 -
 3
3 -
 4
4 -
 5
5 -
 6
6 -
 7
7 -
 8
8 -
 9
9 -
 10
10 -
 11
11 -
 12
12 -
 13
13 -
 14
14 -
 15
15 -
 16
16 -
 17
17 -
 18
18 -
 19
19 -
 20
20 -
 21
21 -
22
-
23
-
24
-
25
-
26
-
27
-
28
-
29
-
30
-
31
-
32
-
33
-
34
-
35
-
36
-
37
-
38
-
39
-
40
-
41
-
42
-
43
-
44
-
45
-
46
-
47
-
48
-
49
-
50
-
51
-
52
-
53
-
54
-
55
-
56
-
57
-
58
-
59
-
60
-
61
-
62
-
63
-
64
-
65
-
66
-
67
-
68
-
69
-
70
-
71
-
72
-
73
-
74
-
75
-
76
-
77
-
78
-
79
-
80
-
81
-
82
-
83
-
84
-
85
-
86
-
87
-
88
-
89
-
90
-
91
-
92
-
93
-
94
-
95
 |
 |

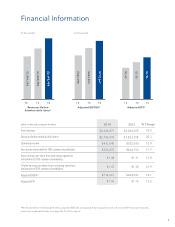
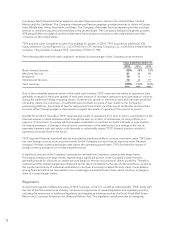
Financial Information
(in thousands) (in thousands)
Adjusted EBITDA*
12 13 14
$624,093
$536,990
$712,267
12 13 14
Revenues Before
Reimbursable Items*
$2,192,978
$1,823,708
$1,541,076
12 13 14
Adjusted EPS*
$1.96
$1.73
$1.47
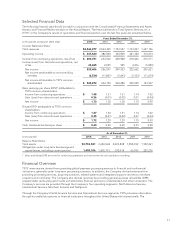
(dollars in thousands, except per share data)
Total revenues
Revenues before reimbursable items*
Operating income
Net income attributable to TSYS common shareholders
Basic earnings per share from continuing operations
attributable to TSYS common shareholders
Diluted earnings per share from continuing operations
attributable to TSYS common shareholders
Adjusted EBITDA*
Adjusted EPS*
18.5
20.2
12.8
31.9
12.8
12.9
14.1
13.2
$2,446,877
$2,192,978
$431,640
$322,872
$1.48
$1.47
$712,267
$1.96
2014 % Change
*Revenues before reimbursable items, adjusted EBITDA and adjusted earnings per share are non-GAAP financial measures,
which are explained further on pages 26-27 of this report.
$2,064,305
$1,823,708
$382,500
$244,750
$1.31
$1.30
$624,093
$1.73
2013
7