NetSpend 2014 Annual Report Download - page 61
Download and view the complete annual report
Please find page 61 of the 2014 NetSpend annual report below. You can navigate through the pages in the report by either clicking on the pages listed below, or by using the keyword search tool below to find specific information within the annual report.-
 1
1 -
2
-
3
-
4
-
5
-
6
-
7
-
8
-
9
-
10
-
11
-
12
-
13
-
14
-
15
-
16
-
17
-
18
-
19
-
20
-
21
-
22
-
23
-
24
-
25
-
26
-
27
-
28
-
29
-
30
-
31
-
32
-
33
-
34
-
35
-
36
-
37
-
38
-
39
-
40
-
41
-
42
-
43
-
44
-
45
-
46
-
47
-
48
-
49
-
50
-
 51
51 -
 52
52 -
 53
53 -
 54
54 -
 55
55 -
 56
56 -
 57
57 -
 58
58 -
 59
59 -
 60
60 -
 61
61 -
 62
62 -
 63
63 -
 64
64 -
 65
65 -
 66
66 -
 67
67 -
 68
68 -
 69
69 -
 70
70 -
 71
71 -
72
-
73
-
74
-
75
-
76
-
77
-
78
-
79
-
80
-
81
-
82
-
83
-
84
-
85
-
86
-
87
-
88
-
89
-
90
-
91
-
92
-
93
-
94
-
95
 |
 |

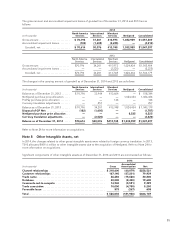
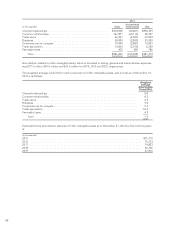
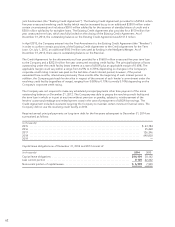
Estimated future amortization expense of licensed computer software, software development costs and
acquisition technology intangibles as of December 31, 2014 for the next five years is:
(in thousands)
Licensed
Computer
Software
Software
Development
Costs
Acquisition
Technology
Intangibles
2015 ......................................................... $41,956 25,334 16,670
2016 ......................................................... 31,960 18,919 15,202
2017 ......................................................... 21,326 13,770 13,718
2018 ......................................................... 11,017 7,689 11,243
2019 ......................................................... 6,097 1,568 11,243
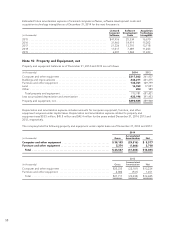
Note 10 Property and Equipment, net
Property and equipment balances as of December 31, 2014 and 2013 are as follows:
(in thousands) 2014 2013
Computer and other equipment ................................................. $317,862 261,937
Buildings and improvements .................................................... 243,211 241,675
Furniture and other equipment .................................................. 135,741 129,799
Land ........................................................................ 16,763 17,021
Other ....................................................................... 204 989
Total property and equipment ................................................. 713,781 651,421
Less accumulated depreciation and amortization ................................... 423,196 391,453
Property and equipment, net .................................................... $290,585 259,968
Depreciation and amortization expense includes amounts for computer equipment, furniture, and other
equipment acquired under capital lease. Depreciation and amortization expense related to property and
equipment was $53.5 million, $45.5 million and $43.4 million for the years ended December 31, 2014, 2013 and
2012, respectively.
The company held the following property and equipment under capital lease as of December 31, 2014 and 2013:
2014
(in thousands) Gross Accumulated
Amortization Net
Computer and other equipment ................................... $ 38,193 (29,816) $ 8,377
Furniture and other equipment .................................... 5,374 (1,666) 3,708
Total ......................................................... $ 43,567 (31,482) $12,085
2013
(in thousands) Gross Accumulated
Amortization Net
Computer and other equipment .................................... $35,335 (22,101) $13,234
Furniture and other equipment ..................................... 2,382 (931) 1,451
Total ......................................................... $37,717 (23,032) $14,685
58