NetSpend 2014 Annual Report Download - page 27
Download and view the complete annual report
Please find page 27 of the 2014 NetSpend annual report below. You can navigate through the pages in the report by either clicking on the pages listed below, or by using the keyword search tool below to find specific information within the annual report.-
 1
1 -
2
-
3
-
4
-
5
-
6
-
7
-
8
-
9
-
10
-
11
-
12
-
13
-
14
-
15
-
16
-
 17
17 -
 18
18 -
 19
19 -
 20
20 -
 21
21 -
 22
22 -
 23
23 -
 24
24 -
 25
25 -
 26
26 -
 27
27 -
 28
28 -
 29
29 -
 30
30 -
 31
31 -
 32
32 -
 33
33 -
 34
34 -
 35
35 -
 36
36 -
 37
37 -
38
-
39
-
40
-
41
-
42
-
43
-
44
-
45
-
46
-
47
-
48
-
49
-
50
-
51
-
52
-
53
-
54
-
55
-
56
-
57
-
58
-
59
-
60
-
61
-
62
-
63
-
64
-
65
-
66
-
67
-
68
-
69
-
70
-
71
-
72
-
73
-
74
-
75
-
76
-
77
-
78
-
79
-
80
-
81
-
82
-
83
-
84
-
85
-
86
-
87
-
88
-
89
-
90
-
91
-
92
-
93
-
94
-
95
 |
 |

Total segment revenues increased $5.5 million for 2013, as compared to 2012. The increase is mainly attributable
to increases in organic growth and $2.7 million in reimbursable items, which is partially offset by a decrease of
$5.6 million foreign currency translation and other adjustments.
Excluding reimbursable items, revenues increased 6.3% for 2014, as compared to 2013, and 2013 increased
0.9%, as compared to 2012, as a result of increases from organic growth, partially offset by decreases in client
deconversions and pricing concessions.
The increase in adjusted segment operating income for 2014 as compared to 2013, is driven primarily from an
increase in revenues partially offset by an increase in employee related expenses. Movements in foreign currency
exchange rates as compared to the U.S. Dollar can result in foreign denominated financial statements being
translated into more or fewer U.S. Dollars, which impacts the comparison to prior periods when the U.S. Dollar
was stronger or weaker.
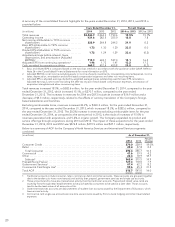
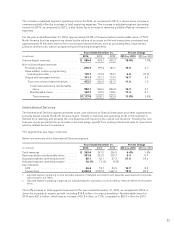
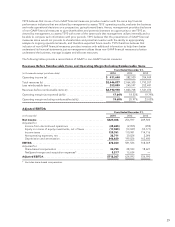
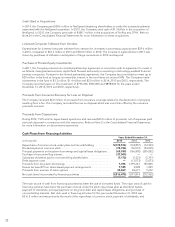
For the year ended December 31, 2014, approximately 38.4% of the revenues before reimbursable items of
TSYS’ International Services segment are driven by the volume of accounts on file and transactions processed
and approximately 61.6% are derived from non-volume based revenues, such as processing fees, value-added
products and services, custom programming and licensing arrangements.
Years Ended December 31, Percent Change
(in millions) 2014 2013 2012 2014 vs. 2013 2013 vs. 2012
Volume-based revenues ................... $131.3 126.7 125.1 3.6% 1.3%
Non-volume related revenues:
Processing fees ......................... 69.4 61.5 53.4 12.7 15.3
Value-added, custom programming,
licensing and other .................... 95.0 92.8 94.4 2.4 (1.8)
Output and managed services ............ 46.1 40.5 45.8 13.9 (11.6)
Total non-volume related revenues ...... 210.5 194.8 193.6 8.1 0.6
Total revenues before reimbursable
items ........................... 341.8 321.5 318.7 6.3 0.9
Reimbursable items ................. 21.6 20.0 17.3 7.5 15.9
Total revenues .................... $363.4 341.5 336.0 6.4% 1.6%
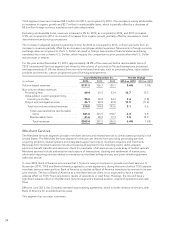
Merchant Services
The Merchant Services segment provides merchant services and related services to clients based primarily in the
United States. The Merchant Services segment’s revenues are derived from providing processing services,
acquiring solutions, related systems and integrated support services to merchant acquirers and merchants.
Revenues from merchant services include processing all payment forms including credit, debit, prepaid,
electronic benefit transfer and electronic check for merchants of all sizes across a wide array of market verticals.
Merchant services include authorization and capture of transactions; clearing and settlement of transactions;
information reporting services related to transactions; merchant billing services; and point-of-sale equipment
sales and service.
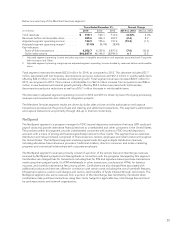
In June 2009, Bank of America announced that it formed a new joint venture to provide merchant services. In
November 2010, TSYS and Bank of America agreed to a new agreement, during the term of which TSYS expects
merchant services revenues from Bank of America to decline as Bank of America transitions its services to its new
joint venture. The loss of Bank of America as a merchant services client is not expected to have a material
adverse effect on TSYS’ financial position, results of operations or cash flows. However, the loss will have a
significant adverse effect on the Merchant Services segment’s financial position, results of operations and cash
flows.
Effective June 2013, the Company renewed its processing agreement, which includes revenue minimums, with
Bank of America for an additional two years.
This segment has no major customers.
24