NetSpend 2014 Annual Report Download - page 59
Download and view the complete annual report
Please find page 59 of the 2014 NetSpend annual report below. You can navigate through the pages in the report by either clicking on the pages listed below, or by using the keyword search tool below to find specific information within the annual report.-
 1
1 -
2
-
3
-
4
-
5
-
6
-
7
-
8
-
9
-
10
-
11
-
12
-
13
-
14
-
15
-
16
-
17
-
18
-
19
-
20
-
21
-
22
-
23
-
24
-
25
-
26
-
27
-
28
-
29
-
30
-
31
-
32
-
33
-
34
-
35
-
36
-
37
-
38
-
39
-
40
-
41
-
42
-
43
-
44
-
45
-
46
-
47
-
48
-
 49
49 -
 50
50 -
 51
51 -
 52
52 -
 53
53 -
 54
54 -
 55
55 -
 56
56 -
 57
57 -
 58
58 -
 59
59 -
 60
60 -
 61
61 -
 62
62 -
 63
63 -
 64
64 -
 65
65 -
 66
66 -
 67
67 -
 68
68 -
 69
69 -
70
-
71
-
72
-
73
-
74
-
75
-
76
-
77
-
78
-
79
-
80
-
81
-
82
-
83
-
84
-
85
-
86
-
87
-
88
-
89
-
90
-
91
-
92
-
93
-
94
-
95
 |
 |

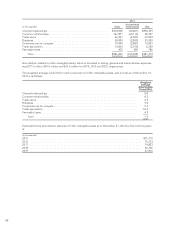
2013
(in thousands) Gross Accumulated
Amortization Net
Channel relationships ............................................. $318,600 (20,261) $298,339
Customer relationships ............................................ 167,871 (69,114) 98,757
Trade name ..................................................... 46,561 (6,527) 40,034
Database ....................................................... 28,000 (2,800) 25,200
Covenants-not-to-compete ........................................ 14,940 (2,887) 12,053
Trade association ................................................. 10,000 (3,750) 6,250
Favorable lease .................................................. 875 (89) 786
Total ....................................................... $586,847 (105,428) $481,419
Amortization related to other intangible assets, which is recorded in selling, general and administrative expenses,
was $77.3 million, $50.0 million and $16.6 million for 2014, 2013 and 2012, respectively.
The weighted average useful life for each component of other intangible assets, and in total, as of December 31,
2014 is as follows:
Weighted
Average
Amortization
Period (Yrs)
Channel relationships ................................................................. 8.0
Customer relationships ................................................................ 8.2
Trade name ......................................................................... 4.9
Database ........................................................................... 5.0
Covenants-not-to-compete ............................................................ 5.3
Trade association .................................................................... 10.0
Favorable Lease ..................................................................... 4.9
Total ........................................................................... 7.6
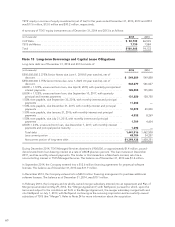
Estimated future amortization expense of other intangible assets as of December 31, 2014 for the next five years
is:
(in thousands)
2015 .................................................................................. $75,770
2016 .................................................................................. 75,213
2017 .................................................................................. 74,823
2018 .................................................................................. 60,166
2019 .................................................................................. 47,870
56