NetSpend 2014 Annual Report Download - page 58
Download and view the complete annual report
Please find page 58 of the 2014 NetSpend annual report below. You can navigate through the pages in the report by either clicking on the pages listed below, or by using the keyword search tool below to find specific information within the annual report.-
 1
1 -
2
-
3
-
4
-
5
-
6
-
7
-
8
-
9
-
10
-
11
-
12
-
13
-
14
-
15
-
16
-
17
-
18
-
19
-
20
-
21
-
22
-
23
-
24
-
25
-
26
-
27
-
28
-
29
-
30
-
31
-
32
-
33
-
34
-
35
-
36
-
37
-
38
-
39
-
40
-
41
-
42
-
43
-
44
-
45
-
46
-
47
-
 48
48 -
 49
49 -
 50
50 -
 51
51 -
 52
52 -
 53
53 -
 54
54 -
 55
55 -
 56
56 -
 57
57 -
 58
58 -
 59
59 -
 60
60 -
 61
61 -
 62
62 -
 63
63 -
 64
64 -
 65
65 -
 66
66 -
 67
67 -
 68
68 -
69
-
70
-
71
-
72
-
73
-
74
-
75
-
76
-
77
-
78
-
79
-
80
-
81
-
82
-
83
-
84
-
85
-
86
-
87
-
88
-
89
-
90
-
91
-
92
-
93
-
94
-
95
 |
 |

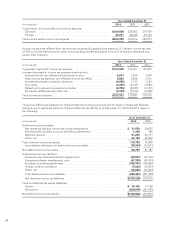
The gross amount and accumulated impairment losses of goodwill as of December 31, 2014 and 2013 are as
follows:
2014
(in thousands) North America
Services International
Services Merchant
Services NetSpend Consolidated
Gross amount ....................... $ 70,796 31,681 415,973 1,032,959 $1,551,409
Accumulated impairment losses ........ (182) (1,605) (2,225) — (4,012)
Goodwill, net ..................... $ 70,614 30,076 413,748 1,032,959 $1,547,397
2013
North America
Services International
Services Merchant
Services NetSpend Consolidated
Gross amount ...................... $70,796 34,201 415,973 1,024,434 $1,545,404
Accumulated impairment losses ....... — — (2,225) — (2,225)
Goodwill, net ..................... $70,796 34,201 413,748 1,024,434 $1,543,179
The changes in the carrying amount of goodwill as of December 31, 2014 and 2013 are as follows:
(in thousands) North America
Services International
Services Merchant
Services NetSpend Consolidated
Balance as of December 31, 2012 ...... $70,796 33,944 413,604 — $ 518,344
NetSpend purchase price allocation .... — — — 1,024,434 1,024,434
ProPay purchase price allocation ....... — — 144 — 144
Currency translation adjustments ....... — 257 — — 257
Balance as of December 31, 2013 ...... $70,796 34,201 413,748 1,024,434 $ 1,543,179
Disposal of GP Net ................. (182) (1,605) — — (1,787)
NetSpend purchase price allocation ... — — — 8,525 8,525
Currency translation adjustments ..... — (2,520) — — (2,520)
Balance as of December 31, 2014 .... $70,614 $30,076 $413,748 $1,032,959 $1,547,397
Refer to Note 24 for more information on acquisitions.
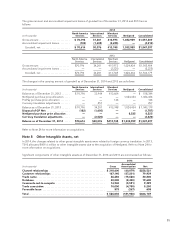
Note 8 Other Intangible Assets, net
In 2014, the changes related to other gross intangible assets were related to foreign currency translation. In 2013,
TSYS allocated $401.6 million to other intangible assets due to the acquisition of NetSpend. Refer to Note 24 for
more information on acquisitions.
Significant components of other intangible assets as of December 31, 2014 and 2013 are summarized as follows:
2014
(in thousands) Gross Accumulated
Amortization Net
Channel relationships ......................................... $ 318,600 (60,079) $258,521
Customer relationships ....................................... 167,140 (87,201) 79,939
Trade name .................................................. 46,480 (15,680) 30,800
Database .................................................... 28,000 (8,400) 19,600
Covenants-not-to-compete .................................... 14,940 (5,551) 9,389
Trade association ............................................ 10,000 (4,750) 5,250
Favorable lease .............................................. 875 (267) 608
Total ........................................................ $ 586,035 (181,928) $404,107
55