NetSpend 2014 Annual Report Download - page 85
Download and view the complete annual report
Please find page 85 of the 2014 NetSpend annual report below. You can navigate through the pages in the report by either clicking on the pages listed below, or by using the keyword search tool below to find specific information within the annual report.-
 1
1 -
2
-
3
-
4
-
5
-
6
-
7
-
8
-
9
-
10
-
11
-
12
-
13
-
14
-
15
-
16
-
17
-
18
-
19
-
20
-
21
-
22
-
23
-
24
-
25
-
26
-
27
-
28
-
29
-
30
-
31
-
32
-
33
-
34
-
35
-
36
-
37
-
38
-
39
-
40
-
41
-
42
-
43
-
44
-
45
-
46
-
47
-
48
-
49
-
50
-
51
-
52
-
53
-
54
-
55
-
56
-
57
-
58
-
59
-
60
-
61
-
62
-
63
-
64
-
65
-
66
-
67
-
68
-
69
-
70
-
71
-
72
-
73
-
74
-
 75
75 -
 76
76 -
 77
77 -
 78
78 -
 79
79 -
 80
80 -
 81
81 -
 82
82 -
 83
83 -
 84
84 -
 85
85 -
 86
86 -
 87
87 -
 88
88 -
 89
89 -
 90
90 -
 91
91 -
 92
92 -
 93
93 -
 94
94 -
 95
95
 |
 |

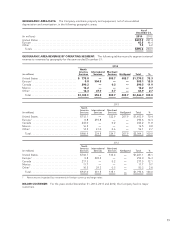
The estimated fair value of identifiable intangible assets acquired in the acquisitions and the related estimated
weighted average useful lives are as follows:
(in thousands) Fair Value
Weighted Average
Useful Life
(in years)
Channel relationships .................................................... $317,000 8.0
Current technology ...................................................... 78,711 7.0
Trade name ............................................................ 44,000 5.0
Database .............................................................. 28,000 5.0
Covenants-not-to-compete ............................................... 11,500 6.0
Favorable lease ......................................................... 875 4.9
Total acquired identifiable intangible assets ................................ $480,086 7.3
The fair value measurement of the identifiable intangible assets represents Level 2 and Level 3 measurements.
Key assumptions include (a) cash flow projections based on market participant and internal data, (b) a discount
rate of 11%, (c) a pre-tax royalty rate range of 2.5-7.0%, (d) attrition rates of 5%-40%, (e) an effective tax rate of
40%, and (f) a terminal value based on a long-term sustainable growth rate of 3%.
In connection with the acquisition, TSYS incurred $3.2 million and $14.2 million in acquisition-related costs
primarily related to professional legal, finance, and accounting costs for the years ended December 31, 2014 and
2013, respectively. These costs were expensed as incurred and are included in merger and acquisition expenses
on the income statement.
Pro Forma Results of Operations
The amounts of NetSpend revenue and earnings included in TSYS’ consolidated income statement for the years
ended December 31, 2013 and 2012, and the pro forma revenue and earnings of the combined entity had the
acquisition date been January 1, 2012 are:
Actual Supplemental pro
forma
Years Ended
December 31, Years Ended
December 31,
(in thousands, except per share data) 2013 2012 2013 2012
Revenue ............................................. $2,064,305 1,793,557 2,286,348 2,144,654
Net income attributable to TSYS common shareholders ...... $ 244,750 244,280 239,775 193,255
Basic EPS attributable to TSYS common shareholders ....... $ 1.30 1.30 1.28 1.03
Diluted EPS attributable to TSYS common shareholders ...... $ 1.29 1.29 1.27 1.02
The unaudited pro forma financial information presented above does not purport to represent what the actual
results of operations would have been if the acquisition of NetSpend’s operations had occurred prior to
January 1, 2012, nor is it indicative of the future operating results of TSYS. The unaudited pro forma financial
information does not reflect the impact of future events that may occur after the acquisition, including, but not
limited to, anticipated cost savings from operating synergies.
The unaudited pro forma financial information presented in the table above has been adjusted to give effect to
adjustments that are (1) directly related to the business combination; (2) factually supportable; and (3) expected
to have a continuing impact. These adjustments include, but are not limited to, the application of accounting
policies; and depreciation and amortization related to fair value adjustments to property, plant and equipment
and intangible assets.
82