NetSpend 2014 Annual Report Download - page 81
Download and view the complete annual report
Please find page 81 of the 2014 NetSpend annual report below. You can navigate through the pages in the report by either clicking on the pages listed below, or by using the keyword search tool below to find specific information within the annual report.-
 1
1 -
2
-
3
-
4
-
5
-
6
-
7
-
8
-
9
-
10
-
11
-
12
-
13
-
14
-
15
-
16
-
17
-
18
-
19
-
20
-
21
-
22
-
23
-
24
-
25
-
26
-
27
-
28
-
29
-
30
-
31
-
32
-
33
-
34
-
35
-
36
-
37
-
38
-
39
-
40
-
41
-
42
-
43
-
44
-
45
-
46
-
47
-
48
-
49
-
50
-
51
-
52
-
53
-
54
-
55
-
56
-
57
-
58
-
59
-
60
-
61
-
62
-
63
-
64
-
65
-
66
-
67
-
68
-
69
-
70
-
 71
71 -
 72
72 -
 73
73 -
 74
74 -
 75
75 -
 76
76 -
 77
77 -
 78
78 -
 79
79 -
 80
80 -
 81
81 -
 82
82 -
 83
83 -
 84
84 -
 85
85 -
 86
86 -
 87
87 -
 88
88 -
 89
89 -
 90
90 -
 91
91 -
92
-
93
-
94
-
95
 |
 |

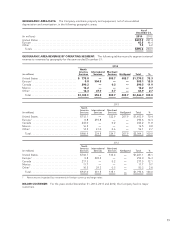
Years Ended December 31,
(in thousands)
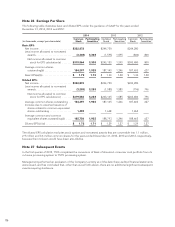
Operating Segments 2014 2013 2012
Revenues before reimbursable items
North America Services ....................................... $ 954,082 860,645 826,750
International Services ......................................... 341,785 321,484 318,730
Merchant Services ............................................ 435,649 446,277 409,698
NetSpend ................................................... 482,686 207,851 —
Intersegment revenues ........................................ (21,224) (12,549) (14,102)
Revenues before reimbursable items from external customers ...... $ 2,192,978 1,823,708 1,541,076
Total revenues
North America Services ....................................... $ 1,117,764 1,000,073 965,393
International Services ......................................... 363,359 341,549 336,047
Merchant Services ............................................ 510,120 533,050 512,580
NetSpend ................................................... 482,686 207,851 —
Intersegment revenues ........................................ (27,052) (18,218) (20,463)
Revenues from external customers ............................ $ 2,446,877 2,064,305 1,793,557
Depreciation and amortization
North America Services ....................................... $ 86,513 74,480 74,673
International Services ......................................... 38,909 41,708 47,889
Merchant Services ............................................ 14,571 12,034 12,083
NetSpend ................................................... 7,509 3,121 —
Segment depreciation and amortization .......................... 147,502 131,343 134,645
Acquisition intangible amortization .............................. 96,971 65,893 26,264
Corporate Administration and Other ............................. 2,147 1,790 2,491
Total depreciation and amortization ........................... $ 246,620 199,026 163,400
Adjusted segment operating income
North America Services ....................................... $ 351,512 321,619 295,171
International Services ......................................... 55,123 42,068 27,211
Merchant Services ............................................ 134,872 155,643 157,409
NetSpend ................................................... 128,285 66,353 —
Total adjusted segment operating income ........................ 669,792 585,683 479,791
Acquisition intangible amortization .............................. (96,971) (65,893) (26,264)
NetSpend merger and acquisition operating expenses ............. (3,217) (14,220) —
Corporate Administration and Other ............................. (137,964) (123,070) (98,558)
Operating income .......................................... $ 431,640 382,500 354,969
As of December 31, 2014 2013
Total assets
North America Services ....................................... $ 3,327,160 3,215,333
International Services ......................................... 356,590 417,379
Merchant Services ............................................ 695,744 676,592
NetSpend ................................................... 1,556,369 1,596,150
Intersegment assets .......................................... (2,202,282) (2,218,886)
Total assets ............................................... $ 3,733,581 3,686,568
78