NetSpend 2014 Annual Report Download - page 89
Download and view the complete annual report
Please find page 89 of the 2014 NetSpend annual report below. You can navigate through the pages in the report by either clicking on the pages listed below, or by using the keyword search tool below to find specific information within the annual report.-
 1
1 -
2
-
3
-
4
-
5
-
6
-
7
-
8
-
9
-
10
-
11
-
12
-
13
-
14
-
15
-
16
-
17
-
18
-
19
-
20
-
21
-
22
-
23
-
24
-
25
-
26
-
27
-
28
-
29
-
30
-
31
-
32
-
33
-
34
-
35
-
36
-
37
-
38
-
39
-
40
-
41
-
42
-
43
-
44
-
45
-
46
-
47
-
48
-
49
-
50
-
51
-
52
-
53
-
54
-
55
-
56
-
57
-
58
-
59
-
60
-
61
-
62
-
63
-
64
-
65
-
66
-
67
-
68
-
69
-
70
-
71
-
72
-
73
-
74
-
75
-
76
-
77
-
78
-
 79
79 -
 80
80 -
 81
81 -
 82
82 -
 83
83 -
 84
84 -
 85
85 -
 86
86 -
 87
87 -
 88
88 -
 89
89 -
 90
90 -
 91
91 -
 92
92 -
 93
93 -
 94
94 -
 95
95
 |
 |

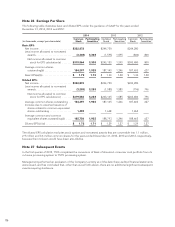
Note 26 Earnings Per Share
The following table illustrates basic and diluted EPS under the guidance of GAAP for the years ended
December 31, 2014, 2013 and 2012:
2014 2013 2012
(in thousands, except per share data)
Common
Stock Participating
Securities Common
Stock Participating
Securities Common
Stock Participating
Securities
Basic EPS:
Net income ........................ $322,872 $244,750 $244,280
Less income allocated to nonvested
awards .......................... (3,308) 3,308 (1,595) 1,595 (800) 800
Net income allocated to common
stock for EPS calculation(a) ....... $319,564 3,308 $243,155 1,595 $243,480 800
Average common shares
outstanding(b) .................... 184,297 1,925 187,145 1,246 187,403 627
Basic EPS(a)/(b) ..................... $ 1.73 1.72 $ 1.30 1.28 $ 1.30 1.28
Diluted EPS:
Net income ........................ $322,872 $244,750 $244,280
Less income allocated to nonvested
awards .......................... (3,288) 3,288 (1,585) 1,585 (796) 796
Net income allocated to common
stock for EPS calculation(c) ....... $319,584 3,288 $243,165 1,585 $243,484 796
Average common shares outstanding . . 184,297 1,925 187,145 1,246 187,403 627
Increase due to assumed issuance of
shares related to common equivalent
shares outstanding ................ 1,459 1,648 1,262
Average common and common
equivalent shares outstanding(d) .... 185,756 1,925 188,793 1,246 188,665 627
Diluted EPS(c)/(d) ................... $ 1.72 1.71 $ 1.29 1.27 $ 1.29 1.27
The diluted EPS calculation excludes stock options and nonvested awards that are convertible into 1.1 million,
2.9 million and 3.6 million common shares for the years ended December 31, 2014, 2013 and 2012, respectively,
because their inclusion would have been anti-dilutive.
Note 27 Subsequent Events
In the first quarter of 2015, TSYS completed the conversion of Bank of America’s consumer card portfolio from its
in-house processing system to TSYS’ processing system.
Management performed an evaluation of the Company’s activity as of the date these audited financial statements
were issued, and has concluded that, other than as set forth above, there are no additional significant subsequent
events requiring disclosure.
86