NetSpend 2014 Annual Report Download - page 23
Download and view the complete annual report
Please find page 23 of the 2014 NetSpend annual report below. You can navigate through the pages in the report by either clicking on the pages listed below, or by using the keyword search tool below to find specific information within the annual report.-
 1
1 -
2
-
3
-
4
-
5
-
6
-
7
-
8
-
9
-
10
-
11
-
12
-
 13
13 -
 14
14 -
 15
15 -
 16
16 -
 17
17 -
 18
18 -
 19
19 -
 20
20 -
 21
21 -
 22
22 -
 23
23 -
 24
24 -
 25
25 -
 26
26 -
 27
27 -
 28
28 -
 29
29 -
 30
30 -
 31
31 -
 32
32 -
 33
33 -
34
-
35
-
36
-
37
-
38
-
39
-
40
-
41
-
42
-
43
-
44
-
45
-
46
-
47
-
48
-
49
-
50
-
51
-
52
-
53
-
54
-
55
-
56
-
57
-
58
-
59
-
60
-
61
-
62
-
63
-
64
-
65
-
66
-
67
-
68
-
69
-
70
-
71
-
72
-
73
-
74
-
75
-
76
-
77
-
78
-
79
-
80
-
81
-
82
-
83
-
84
-
85
-
86
-
87
-
88
-
89
-
90
-
91
-
92
-
93
-
94
-
95
 |
 |

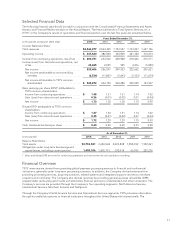
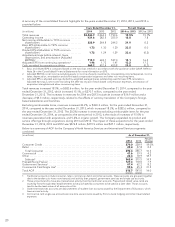
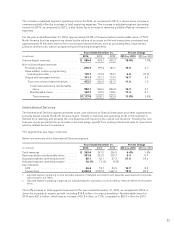
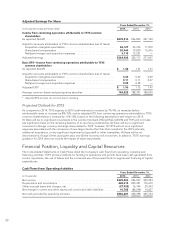
A summary of the consolidated financial highlights for the years ended December 31, 2014, 2013, and 2012 is
provided below:
Years Ended December 31, Percent Change
(in millions) 2014 2013 2012 2014 vs. 2013 2013 vs. 2012
Total revenues .............................. $2,446.9 2,064.3 1,793.6 18.5% 15.1%
Operating income ........................... 431.6 382.5 355.0 12.8 7.8
Net income attributable to TSYS common
shareholders .............................. 322.9 244.8 244.3 31.9 0.2
Basic EPS attributable to TSYS common
shareholders1............................. 1.73 1.30 1.30 33.5 0.0
Diluted EPS attributable to TSYS common
shareholders1............................. 1.72 1.29 1.29 33.6 (0.2)
Adjusted earnings before interest, taxes,
depreciation, and amortization (Adjusted
EBITDA)2................................. 712.3 624.1 537.0 14.1 16.2
Adjusted EPS from continuing operations3....... 1.96 1.73 1.47 13.2 17.3
Cash provided by operating activities ........... 560.2 452.4 455.8 23.8 (0.7)
1 Basic and diluted EPS is computed based on the two-class method in accordance with the guidance under GAAP. Refer to
Note 26 in the Consolidated Financial Statements for more information on EPS.
2 Adjusted EBITDA is net income excluding equity in income of equity investments, nonoperating income/(expense), income
taxes, depreciation, amortization and stock-based compensation expenses and other non-recurring items.
3 Adjusted EPS is adjusted earnings divided by weighted average shares outstanding used for basic EPS calculations.
Adjusted earnings is net income excluding the after-tax impact of stock-based compensation expenses, amortization of
acquisition intangibles and other nonrecurring items.
Total revenues increased 18.5%, or $382.6 million, for the year ended December 31, 2014, compared to the year
ended December 31, 2013, which increased 15.1%, or $270.7 million, compared to the year ended
December 31, 2012. The increases in revenues for 2014 and 2013 include an increase of $14.9 million and a
decrease of $5.3 million, respectively, related to the effects of currency translation of the Company’s foreign-
based subsidiaries and branches.
Excluding reimbursable items, revenues increased 20.2%, or $369.3 million, for the year ended December 31,
2014, compared to the year ended December 31, 2013, which increased 18.3%, or $282.6 million, compared to
the year ended December 31, 2012. The 20.2% increase in revenues excluding reimbursable items for the year
ended December 31, 2014, as compared to the same period in 2013, is the result of increases of 15.0% in
revenues associated with acquisitions, and 5.2% in organic growth. The Company expanded its product and
service offerings through acquisitions during 2013 and 2012. The impact of these acquisitions for the years ended
December 31, 2014, 2013 and 2012 was $274.8 million, $273.9 million and $27.1 million, respectively.
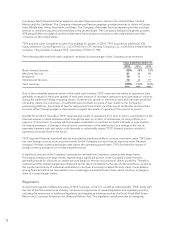
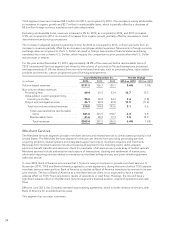
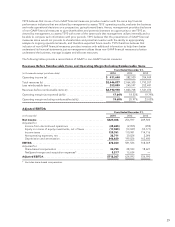
Below is a summary of AOF for the Company’s North America Services and International Services segments
combined:
(in millions) As of December 31,
2014 2013 Percent
Change
Consumer Credit ........................................................... 270.0 228.9 18.0%
Retail ..................................................................... 28.4 27.8 2.2
Total Consumer .......................................................... 298.4 256.7 16.3
Commercial ............................................................... 41.6 39.9 4.2
Other ..................................................................... 22.4 18.9 18.7
Subtotal1................................................................ 362.4 315.5 14.9
Prepaid/Stored Value2....................................................... 127.3 118.0 7.9
Government Services3....................................................... 67.4 62.2 8.2
Commercial Card Single Use4................................................. 59.6 45.3 31.5
Total AOF ................................................................. 616.7 541.0 14.0
1 Traditional accounts include consumer, retail, commercial, debit and other accounts. These accounts are grouped together
due to the tendency to have more transactional activity than prepaid, government services and single use accounts.
2 These accounts tend to have less transactional activity than the traditional accounts. Prepaid and stored value cards are
issued by firms through retail establishments to be purchased by consumers to be used at a later date. These accounts
tend to be the least active of all accounts on file.
3 Government services accounts are disbursements of student loan accounts issued by the Department of Education, which
have minimal activity.
4 Commercial card single use accounts are one-time use accounts issued by firms to book lodging and other travel related
expenses.
20