NetSpend 2014 Annual Report Download - page 28
Download and view the complete annual report
Please find page 28 of the 2014 NetSpend annual report below. You can navigate through the pages in the report by either clicking on the pages listed below, or by using the keyword search tool below to find specific information within the annual report.-
 1
1 -
2
-
3
-
4
-
5
-
6
-
7
-
8
-
9
-
10
-
11
-
12
-
13
-
14
-
15
-
16
-
17
-
 18
18 -
 19
19 -
 20
20 -
 21
21 -
 22
22 -
 23
23 -
 24
24 -
 25
25 -
 26
26 -
 27
27 -
 28
28 -
 29
29 -
 30
30 -
 31
31 -
 32
32 -
 33
33 -
 34
34 -
 35
35 -
 36
36 -
 37
37 -
 38
38 -
39
-
40
-
41
-
42
-
43
-
44
-
45
-
46
-
47
-
48
-
49
-
50
-
51
-
52
-
53
-
54
-
55
-
56
-
57
-
58
-
59
-
60
-
61
-
62
-
63
-
64
-
65
-
66
-
67
-
68
-
69
-
70
-
71
-
72
-
73
-
74
-
75
-
76
-
77
-
78
-
79
-
80
-
81
-
82
-
83
-
84
-
85
-
86
-
87
-
88
-
89
-
90
-
91
-
92
-
93
-
94
-
95
 |
 |

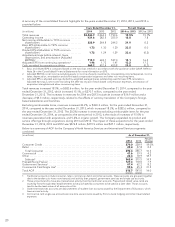
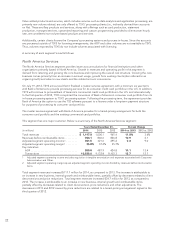
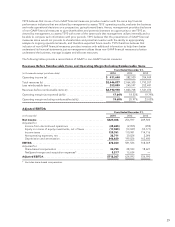
Below is a summary of the Merchant Services segment:
Years Ended December 31, Percent Change
(in millions) 2014 2013 2012 2014 vs. 2013 2013 vs. 2012
Total revenues ........................... $ 510.1 533.1 512.6 (4.3)% 4.0%
Revenues before reimbursable items ......... 435.6 446.3 409.7 (2.4) 8.9
Adjusted segment operating income1........ 134.9 155.6 157.4 (13.3) (1.1)
Adjusted segment operating margin2........ 31.0% 34.9% 38.4%
Key indicators:
Point-of-Sale transactions ................ 4,052.7 4,359.8 4,877.6 (7.0) (10.6)
Dollar sales volume ..................... $46,847.0 44,144.0 38,994.0 6.1 13.2
1 Adjusted segment operating income excludes acquisition intangible amortization and expenses associated with Corporate
Administration and Other.
2 Adjusted segment operating margin equals adjusted segment operating income divided by revenues before reimbursable
items.
Total segment revenues decreased $23.0 million for 2014, as compared to 2013. This decrease includes $33.7
million associated with lost business, deconversions and price reductions and $12.3 million in reimbursable items
offset by $23.0 million in new business and internal growth. Total segment revenues increased $20.5 million for
2013, as compared to 2012. This increase is attributable to a $62.4 million increase from acquisitions and $26.6
million in new business and internal growth partially offset by $52.4 million associated with lost business,
deconversions and price reductions as well as a $16.1 million decrease in reimbursable items.
The decrease in adjusted segment operating income for 2014 and 2013 is driven by lower third party processing
revenues and incremental costs related to integration projects.
The Merchant Services segment results are driven by dollar sales volume and the authorization and capture
transactions processed at the point-of-sale and clearing and settlement transactions. This segment’s authorization
and capture transactions are primarily through dial-up or Internet connectivity.
NetSpend
The NetSpend segment is a program manager for FDIC-insured depository institutions that issue GPR cards and
payroll cards and provide alternative financial services to underbanked and other consumers in the United States.
The products within this segment provide underbanked consumers with access to FDIC-insured depository
accounts with a menu of pricing and features specifically tailored to their needs. This segment has an extensive
distribution and reload network comprised of financial service centers, employers and retail locations throughout
the United States. The NetSpend segment markets prepaid cards through multiple distribution channels,
including alternative financial service providers, traditional retailers, direct-to-consumer and online marketing
programs and contractual relationships with corporate employers.
The NetSpend segment’s revenues primarily consist of a portion of the service fees and interchange revenues
received by NetSpend’s prepaid card Issuing Banks in connection with the programs managed by this segment.
Cardholders are charged fees for transactions including fees for PIN and signature-based purchase transactions
made using their prepaid cards, for ATM withdrawals or other transactions conducted at ATMs, for balance
inquiries, and monthly maintenance fees among others. Cardholders are also charged fees associated with
additional products and services offered in connection with certain cards including the use of overdraft features,
bill payment options, custom card designs and card-to-card transfers of funds initiated through call centers. The
NetSpend segment also earns revenues from a portion of the interchange fees remitted by merchants when
cardholders make purchase transactions using their cards. Subject to applicable law, interchange fees are fixed
by card associations and network organizations.
25