NetSpend 2014 Annual Report Download - page 66
Download and view the complete annual report
Please find page 66 of the 2014 NetSpend annual report below. You can navigate through the pages in the report by either clicking on the pages listed below, or by using the keyword search tool below to find specific information within the annual report.-
 1
1 -
2
-
3
-
4
-
5
-
6
-
7
-
8
-
9
-
10
-
11
-
12
-
13
-
14
-
15
-
16
-
17
-
18
-
19
-
20
-
21
-
22
-
23
-
24
-
25
-
26
-
27
-
28
-
29
-
30
-
31
-
32
-
33
-
34
-
35
-
36
-
37
-
38
-
39
-
40
-
41
-
42
-
43
-
44
-
45
-
46
-
47
-
48
-
49
-
50
-
51
-
52
-
53
-
54
-
55
-
 56
56 -
 57
57 -
 58
58 -
 59
59 -
 60
60 -
 61
61 -
 62
62 -
 63
63 -
 64
64 -
 65
65 -
 66
66 -
 67
67 -
 68
68 -
 69
69 -
 70
70 -
 71
71 -
 72
72 -
 73
73 -
 74
74 -
 75
75 -
 76
76 -
77
-
78
-
79
-
80
-
81
-
82
-
83
-
84
-
85
-
86
-
87
-
88
-
89
-
90
-
91
-
92
-
93
-
94
-
95
 |
 |
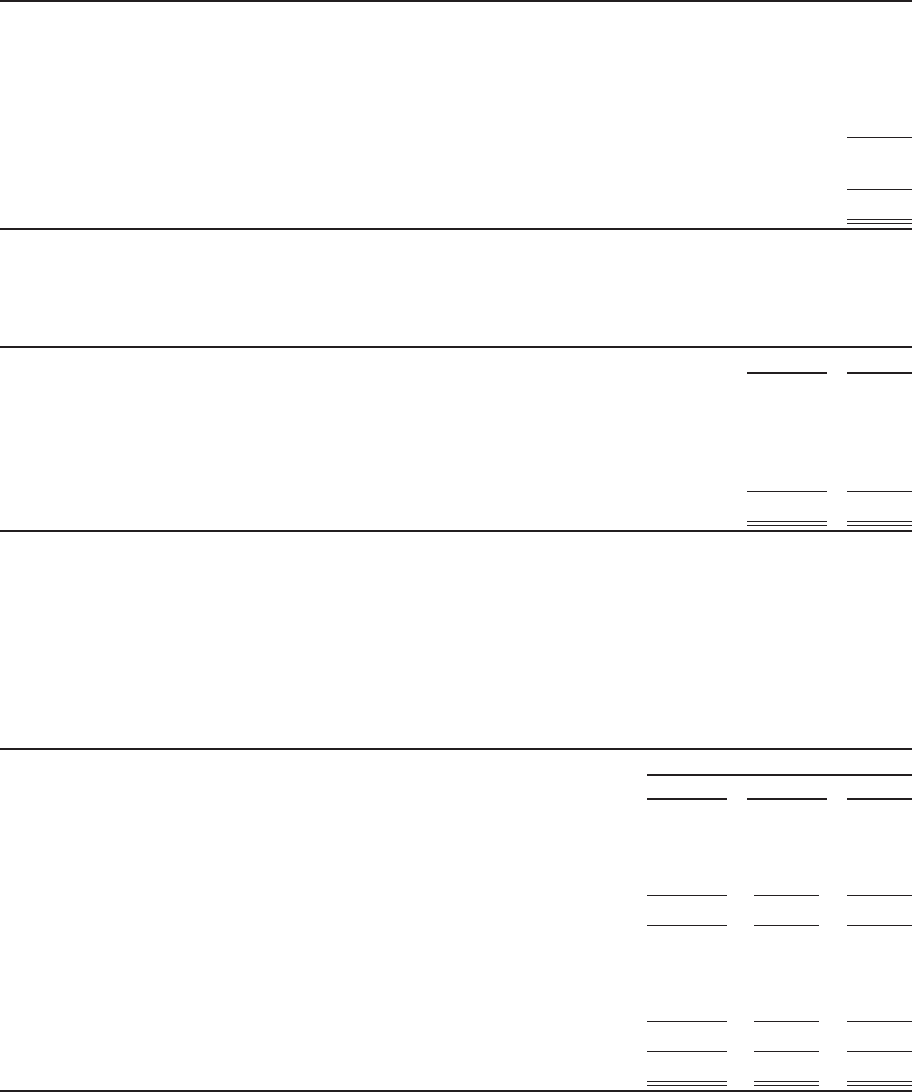
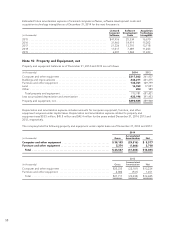
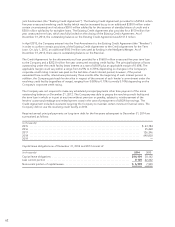
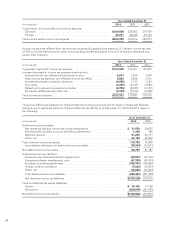
The future minimum lease payments under capital leases as of December 31, 2014 are summarized as follows:
(in thousands)
2015 .................................................................................. $ 7,355
2016 .................................................................................. 3,554
2017 .................................................................................. 2,627
2018 .................................................................................. 987
2019 .................................................................................. 63
Total minimum lease payments ............................................................ 14,586
Less amount representing interest .......................................................... 485
Principal minimum lease payments ......................................................... $14,101
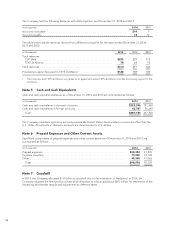
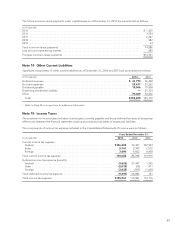
Note 14 Other Current Liabilities
Significant components of other current liabilities as of December 31, 2014 and 2013 are summarized as follows:
(in thousands) 2014 2013
Deferred revenues ............................................................ $ 41,773 36,408
Accrued expenses ............................................................. 23,617 23,265
Dividends payable ............................................................ 19,006 19,508
Dissenting shareholder liability1................................................. —25,723
Other ....................................................................... 70,409 54,266
Total ...................................................................... $154,805 159,170
1Refer to Note 24 on acquisitions for additional information.
Note 15 Income Taxes
The provision for income taxes includes income taxes currently payable and those deferred because of temporary
differences between the financial statement carrying amounts and tax bases of assets and liabilities.
The components of income tax expense included in the Consolidated Statements of Income were as follows:
Years Ended December 31,
(in thousands) 2014 2013 2012
Current income tax expense:
Federal ......................................................... $126,203 74,327 102,953
State ........................................................... 5,161 2,949 2,572
Foreign ......................................................... 7,694 6,822 8,450
Total current income tax expense ..................................... 139,058 84,098 113,975
Deferred income tax expense (benefit):
Federal ......................................................... (3,623) 27,447 1,395
State ........................................................... (2,039) (55) 411
Foreign ......................................................... (3,635) (509) (1,665)
Total deferred income tax expense .................................... (9,297) 26,883 141
Total income tax expense ............................................ $129,761 110,981 114,116
63