NetSpend 2014 Annual Report Download - page 77
Download and view the complete annual report
Please find page 77 of the 2014 NetSpend annual report below. You can navigate through the pages in the report by either clicking on the pages listed below, or by using the keyword search tool below to find specific information within the annual report.-
 1
1 -
2
-
3
-
4
-
5
-
6
-
7
-
8
-
9
-
10
-
11
-
12
-
13
-
14
-
15
-
16
-
17
-
18
-
19
-
20
-
21
-
22
-
23
-
24
-
25
-
26
-
27
-
28
-
29
-
30
-
31
-
32
-
33
-
34
-
35
-
36
-
37
-
38
-
39
-
40
-
41
-
42
-
43
-
44
-
45
-
46
-
47
-
48
-
49
-
50
-
51
-
52
-
53
-
54
-
55
-
56
-
57
-
58
-
59
-
60
-
61
-
62
-
63
-
64
-
65
-
66
-
 67
67 -
 68
68 -
 69
69 -
 70
70 -
 71
71 -
 72
72 -
 73
73 -
 74
74 -
 75
75 -
 76
76 -
 77
77 -
 78
78 -
 79
79 -
 80
80 -
 81
81 -
 82
82 -
 83
83 -
 84
84 -
 85
85 -
 86
86 -
 87
87 -
88
-
89
-
90
-
91
-
92
-
93
-
94
-
95
 |
 |

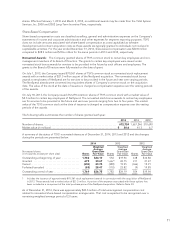
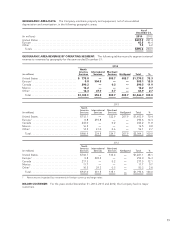
A summary of TSYS’ stock option activity as of December 31, 2014, 2013 and 2012, and changes during the years
ended on those dates is presented below:
2014 2013 2012
(in thousands,
except per share data) Options
Weighted
Average
Exercise Price Options
Weighted
Average
Exercise Price Options
Weighted
Average
Exercise Price
Options:
Outstanding at beginning of year . . 5,752 $20.96 6,065 $21.27 6,082 $20.61
Granted 1...................... 1,046 30.96 1,940 17.42 818 22.95
Exercised ...................... (1,850) 18.79 (2,177) 18.75 (619) 16.15
Forfeited/canceled .............. (56) 28.88 (76) 16.78 (216) 23.73
Outstanding at end of year ........ 4,892 $23.83 5,752 $20.96 6,065 $21.27
Options exercisable at year-end .... 2,781 $22.86 3,232 $23.02 3,235 $24.12
Weighted average fair value of
options granted during the
year ......................... $ 7.66 $ 9.48 $ 5.27
1 Includes the issuance of approximately 1.1 million stock option replacement awards in connection with the acquisition of
NetSpend in 2013. These awards had a market value of $13.7 million. A portion of the expense associated with these
awards has been included as a component of the total purchase price of the NetSpend acquisition. Refer to Note 24.
As of December 31, 2014 the average remaining contractual life and intrinsic value of TSYS’ outstanding and
exercisable stock options were as follows:
Outstanding Exercisable
Average remaining contractual life (in years) ................................... 6.6 5.1
Aggregate intrinsic value (in thousands) ....................................... $49,548 30,866
Shares Issued for Options Exercised
During 2014, 2013 and 2012, employees of the Company exercised options for shares of TSYS common stock
that were issued from treasury. The table below summarizes these stock option exercises by year:
(in thousands)
Options Exercised
and Issued from
Treasury Intrinsic Value
2014 ............................................................. (1,850) $22,883
2013 ............................................................. 2,177 16,580
2012 ............................................................. 619 4,243
For awards granted before January 1, 2006 that were not fully vested on January 1, 2006, the Company will
record the tax benefits from the exercise of stock options as increases to the “Additional paid-in capital” line item
of the Consolidated Balance Sheets. If the Company does recognize tax benefits, the Company will record these
tax benefits from share-based compensation costs as cash inflows in the financing section and cash outflows in
the operating section in the Statement of Cash Flows. The Company has elected to use the short-cut method to
calculate its historical pool of windfall tax benefits.
As of December 31, 2014, there was approximately $5.7 million of total unrecognized compensation cost related
to TSYS stock options that is expected to be recognized over a remaining weighted average period of 1.2 years.
74