NetSpend 2014 Annual Report Download - page 55
Download and view the complete annual report
Please find page 55 of the 2014 NetSpend annual report below. You can navigate through the pages in the report by either clicking on the pages listed below, or by using the keyword search tool below to find specific information within the annual report.-
 1
1 -
2
-
3
-
4
-
5
-
6
-
7
-
8
-
9
-
10
-
11
-
12
-
13
-
14
-
15
-
16
-
17
-
18
-
19
-
20
-
21
-
22
-
23
-
24
-
25
-
26
-
27
-
28
-
29
-
30
-
31
-
32
-
33
-
34
-
35
-
36
-
37
-
38
-
39
-
40
-
41
-
42
-
43
-
44
-
 45
45 -
 46
46 -
 47
47 -
 48
48 -
 49
49 -
 50
50 -
 51
51 -
 52
52 -
 53
53 -
 54
54 -
 55
55 -
 56
56 -
 57
57 -
 58
58 -
 59
59 -
 60
60 -
 61
61 -
 62
62 -
 63
63 -
 64
64 -
 65
65 -
66
-
67
-
68
-
69
-
70
-
71
-
72
-
73
-
74
-
75
-
76
-
77
-
78
-
79
-
80
-
81
-
82
-
83
-
84
-
85
-
86
-
87
-
88
-
89
-
90
-
91
-
92
-
93
-
94
-
95
 |
 |
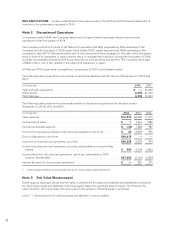
RECLASSIFICATIONS: Certain reclassifications have been made to the 2013 and 2012 financial statements to
conform to the presentation adopted in 2014.
Note 2 Discontinued Operations
In accordance with GAAP, the Company determined its Japan-based businesses became discontinued
operations in the first quarter of 2014.
The Company sold all of its stock of GP Network Corporation (GP Net) (representing 54% ownership of the
company) and all of its stock of TSYS Japan Godo Kaisha (TSYS Japan) (representing 100% ownership of the
company) in April 2014. Both entities were part of the International Services segment. The sale of the Company’s
stock in both of its operations in Japan was the result of management’s decision during the first quarter of 2014,
to divest non-strategic businesses and focus resources on core products and services. The Company had a gain
of $48.6 million, net of tax, related to the sales of its operations in Japan.
GP Net and TSYS Japan were not significant components of TSYS’ consolidated results.
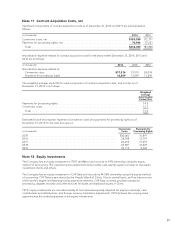
The following table presents the main classes of assets and liabilities held for sale as of December 31, 2014 and
2013:
(in thousands) 2014 2013
Cash and cash equivalents ......................................................... $—30,530
Other assets ..................................................................... 4,003 26,378
Total liabilities ................................................................... 4,003 10,333
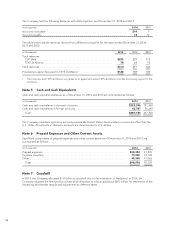
The following table presents the summarized results of discontinued operations for the years ended
December 31, 2014, 2013 and 2012:
(in thousands) 2014 2013 2012
Total revenues .......................................................... $16,376 68,048 77,415
Income before taxes ..................................................... $13,443 1,982
Income tax (benefit) expense .............................................. $ (39) 1,388 987
Income from operating activities of discontinued operations, net of tax ........... $402,055 995
Gain on dispositions, net of tax ............................................ $48,615 ——
Income from discontinued operations, net of tax .............................. $48,655 2,055 995
Income from discontinued operations, net of tax, attributable to noncontrolling
interest .............................................................. $ 999 4,198 3,864
Income (loss) from discontinued operations, net of tax, attributable to TSYS
common shareholders .................................................. $47,656 (2,143) (2,869)
Interest allocated to discontinued operations1................................ $— 281 275
1 Interest expense relates to borrowings directly for use by Japan-based operations
Note 3 Fair Value Measurement
GAAP requires disclosure about how fair value is determined for assets and liabilities and establishes a hierarchy
for which these assets and liabilities must be grouped, based on significant level of inputs. The three-tier fair
value hierarchy, which prioritizes the inputs used in the valuation methodologies, is as follows:
Level 1 — Quoted prices for identical assets and liabilities in active markets.
52