NetSpend 2014 Annual Report Download - page 32
Download and view the complete annual report
Please find page 32 of the 2014 NetSpend annual report below. You can navigate through the pages in the report by either clicking on the pages listed below, or by using the keyword search tool below to find specific information within the annual report.-
 1
1 -
2
-
3
-
4
-
5
-
6
-
7
-
8
-
9
-
10
-
11
-
12
-
13
-
14
-
15
-
16
-
17
-
18
-
19
-
20
-
21
-
 22
22 -
 23
23 -
 24
24 -
 25
25 -
 26
26 -
 27
27 -
 28
28 -
 29
29 -
 30
30 -
 31
31 -
 32
32 -
 33
33 -
 34
34 -
 35
35 -
 36
36 -
 37
37 -
 38
38 -
 39
39 -
 40
40 -
 41
41 -
 42
42 -
43
-
44
-
45
-
46
-
47
-
48
-
49
-
50
-
51
-
52
-
53
-
54
-
55
-
56
-
57
-
58
-
59
-
60
-
61
-
62
-
63
-
64
-
65
-
66
-
67
-
68
-
69
-
70
-
71
-
72
-
73
-
74
-
75
-
76
-
77
-
78
-
79
-
80
-
81
-
82
-
83
-
84
-
85
-
86
-
87
-
88
-
89
-
90
-
91
-
92
-
93
-
94
-
95
 |
 |

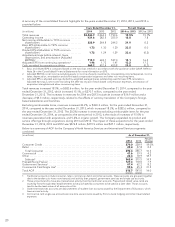
TSYS believes that its use of non-GAAP financial measures provides investors with the same key financial
performance indicators that are utilized by management to assess TSYS’ operating results, evaluate the business
and make operational decisions on a prospective, going-forward basis. Hence, management provides disclosure
of non-GAAP financial measures to give shareholders and potential investors an opportunity to see TSYS as
viewed by management, to assess TSYS with some of the same tools that management utilizes internally and to
be able to compare such information with prior periods. TSYS believes that the presentation of GAAP financial
measures alone would not provide its shareholders and potential investors with the ability to appropriately
analyze its ongoing operational results, and therefore expected future results. TSYS therefore believes that
inclusion of non-GAAP financial measures provides investors with additional information to help them better
understand its financial statements just as management utilizes these non-GAAP financial measures to better
understand the business, manage budgets and allocate resources.
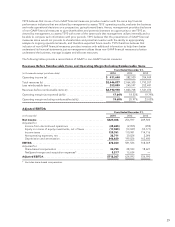
The following tables provide a reconciliation of GAAP to non-GAAP financial measures:
Revenues Before Reimbursable Items and Operating Margin Excluding Reimbursable Items
Years Ended December 31,
(in thousands except per share data) 2014 2013 2012
Operating income (a) ......................................... $ 431,640 382,500 354,969
Total revenues (b) ............................................ $2,446,877 2,064,305 1,793,557
Less reimbursable items ....................................... 253,899 240,597 252,481
Revenues before reimbursable items (c) .......................... $2,192,978 1,823,708 1,541,076
Operating margin (as reported) (a)/(b) ........................... 17.64% 18.53% 19.79%
Operating margin excluding reimbursables (a)/(c) .................. 19.68% 20.97% 23.03%
Adjusted EBITDA
Years Ended December 31,
(in thousands) 2014 2013 2012
Net income ................................................. $329,406 256,597 249,923
Adjusted for:
Income from discontinued operations ......................... (48,655) (2,055) (995)
Equity in income of equity investments, net of taxes .............. (17,583) (13,047) (10,171)
Income taxes .............................................. 129,761 110,981 114,116
Nonoperating expenses, net ................................. 38,711 30,024 2,096
Depreciation and amortization ................................ 246,620 199,026 163,400
EBITDA .................................................... 678,260 581,526 518,369
Adjusted for:
Share-based compensation .................................. 30,790 28,933 18,621
NetSpend merger and acquisition expenses* ................... 3,217 13,634 —
Adjusted EBITDA ............................................ $712,267 624,093 536,990
* Excludes share-based compensation
29