NetSpend 2014 Annual Report Download - page 25
Download and view the complete annual report
Please find page 25 of the 2014 NetSpend annual report below. You can navigate through the pages in the report by either clicking on the pages listed below, or by using the keyword search tool below to find specific information within the annual report.-
 1
1 -
2
-
3
-
4
-
5
-
6
-
7
-
8
-
9
-
10
-
11
-
12
-
13
-
14
-
 15
15 -
 16
16 -
 17
17 -
 18
18 -
 19
19 -
 20
20 -
 21
21 -
 22
22 -
 23
23 -
 24
24 -
 25
25 -
 26
26 -
 27
27 -
 28
28 -
 29
29 -
 30
30 -
 31
31 -
 32
32 -
 33
33 -
 34
34 -
 35
35 -
36
-
37
-
38
-
39
-
40
-
41
-
42
-
43
-
44
-
45
-
46
-
47
-
48
-
49
-
50
-
51
-
52
-
53
-
54
-
55
-
56
-
57
-
58
-
59
-
60
-
61
-
62
-
63
-
64
-
65
-
66
-
67
-
68
-
69
-
70
-
71
-
72
-
73
-
74
-
75
-
76
-
77
-
78
-
79
-
80
-
81
-
82
-
83
-
84
-
85
-
86
-
87
-
88
-
89
-
90
-
91
-
92
-
93
-
94
-
95
 |
 |

Value added products and services, which includes services such as data analytics and application processing, are
primarily non-volume related, are only offered to TSYS’ processing clients (i.e., indirectly derived from accounts
on file). These ancillary products and services, along with offerings such as card production, statement
production, managed services, customized reporting and custom programming provided to clients at an hourly
rate, are considered non-volume based products and services.
Additionally, certain clients license the Company’s processing systems and process in-house. Since the accounts
are processed outside of TSYS for licensing arrangements, the AOF and other volumes are not available to TSYS.
Thus, volumes reported by TSYS do not include volumes associated with licensing.
A summary of each segment’s results follows:
North America Services
The North America Services segment provides issuer account solutions for financial institutions and other
organizations primarily based in North America. Growth in revenues and operating profit in this segment is
derived from retaining and growing the core business and improving the overall cost structure. Growing the core
business comes primarily from an increase in account usage, growth from existing clients (also referred to as
organic growth) and sales to new clients and the related account conversions.
On July 19, 2012, TSYS announced that it finalized a master services agreement, with a minimum six year term,
with Bank of America to provide processing services for its consumer credit card portfolios in the U.S. In addition,
TSYS will continue to process Bank of America’s commercial credit card portfolios in the U.S. and internationally.
In the first quarter of 2015, TSYS completed the conversion of Bank of America’s consumer card portfolio from its
in-house processing system to TSYS’ processing system. Following the processing term, the agreement provides
Bank of America the option to use the TS2 software pursuant to a license under a long-term payment structure
for purposes of processing its consumer card portfolio.
The master services agreement with Bank of America provides for a tiered-pricing arrangement for both the
consumer card portfolio and the existing commercial card portfolios.
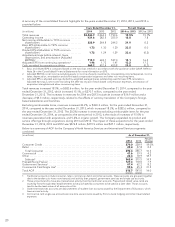
This segment has one major customer. Below is a summary of the North America Services segment:
Years Ended December 31, Percent Change
(in millions) 2014 2013 2012 2014 vs. 2013 2013 vs. 2012
Total revenues ........................... $ 1,117.8 1,000.1 965.4 11.8% 3.6%
Revenues before reimbursable items ......... 954.1 860.6 826.8 10.9 4.1
Adjusted segment operating income1........ 351.5 321.6 295.2 9.3 9.0
Adjusted segment operating margin2........ 36.8% 37.4% 35.7%
Key indicators:
AOF.................................. 550.0 481.9 424.8 14.1 13.4
Transactions ........................... 10,838.0 9,132.8 8,102.3 18.7 12.7
1 Adjusted segment operating income excludes acquisition intangible amortization and expenses associated with Corporate
Administration and Other.
2 Adjusted segment operating margin equals adjusted segment operating income divided by revenues before reimbursable
items.
Total segment revenues increased $117.7 million for 2014, as compared to 2013. The increase is attributable to
an increase in new business, internal growth and reimbursable items, partially offset by decreases related to client
deconversions and price reductions. Total segment revenues increased $34.7 million for 2013, as compared to
2012. The increase is attributable to an increase in new business, internal growth and reimbursable items,
partially offset by decreases related to client deconversion, price reductions and other adjustments. The
decreases in 2013 and 2012 caused by price reductions are related to a tiered-pricing arrangement signed in the
third quarter of 2012.
22