NetSpend 2014 Annual Report Download - page 34
Download and view the complete annual report
Please find page 34 of the 2014 NetSpend annual report below. You can navigate through the pages in the report by either clicking on the pages listed below, or by using the keyword search tool below to find specific information within the annual report.-
 1
1 -
2
-
3
-
4
-
5
-
6
-
7
-
8
-
9
-
10
-
11
-
12
-
13
-
14
-
15
-
16
-
17
-
18
-
19
-
20
-
21
-
22
-
23
-
 24
24 -
 25
25 -
 26
26 -
 27
27 -
 28
28 -
 29
29 -
 30
30 -
 31
31 -
 32
32 -
 33
33 -
 34
34 -
 35
35 -
 36
36 -
 37
37 -
 38
38 -
 39
39 -
 40
40 -
 41
41 -
 42
42 -
 43
43 -
 44
44 -
45
-
46
-
47
-
48
-
49
-
50
-
51
-
52
-
53
-
54
-
55
-
56
-
57
-
58
-
59
-
60
-
61
-
62
-
63
-
64
-
65
-
66
-
67
-
68
-
69
-
70
-
71
-
72
-
73
-
74
-
75
-
76
-
77
-
78
-
79
-
80
-
81
-
82
-
83
-
84
-
85
-
86
-
87
-
88
-
89
-
90
-
91
-
92
-
93
-
94
-
95
 |
 |

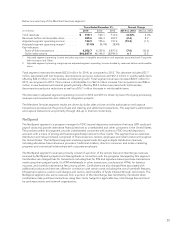
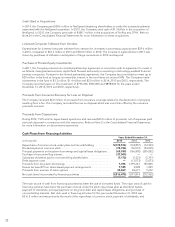
TSYS’ main source of funds is derived from operating activities, specifically net income. The increase in 2014, as
compared to 2013, in net cash provided by operating activities was primarily the result of increased earnings. The
decrease in 2013, as compared to 2012, in net cash provided by operating activities was primarily the result of
the net change in current and other assets and current and other liabilities partially offset by increased earnings.
Net change in current and other assets and current and other liabilities include accounts receivable, prepaid
expenses, other current assets and other assets, accounts payable, accrued salaries and employee benefits and
other liabilities. The change in accounts receivable between the years is the result of timing of collections
compared to billings. The change in accounts payable and other liabilities between years is the result of the
timing of payments and funding of performance-based incentives.
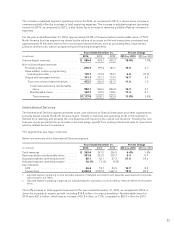
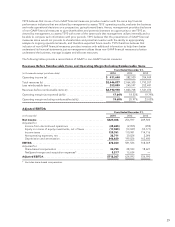
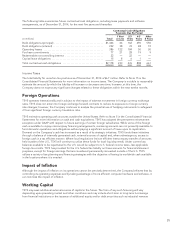
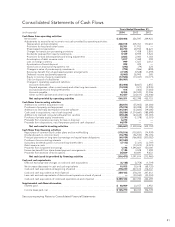
Cash Flows from Investing Activities
Years Ended December 31,
(in thousands) 2014 2013 2012
Additions to contract acquisition costs ................................ $ (88,871) (55,965) (34,384)
Purchases of property and equipment, net ............................ (75,913) (40,598) (31,395)
Additions to internally developed computer software ................... (41,501) (33,600) (19,285)
Cash used in acquisitions, net of cash acquired ........................ (38,584) (1,314,660) (188,698)
Additions to licensed computer software from vendors .................. (29,638) (63,635) (33,001)
Purchase of private equity investments ............................... (3,291) (1,378) (3,031)
Proceeds from insurance recovery for loss on disposal ................... 6,212 ——
Proceeds from dispositions, net of expenses paid and cash disposed ...... 44,979 ——
Net cash used in investing activities .................................. $(226,607) (1,509,836) (309,794)
The major uses of cash for investing activities in 2014, 2013 and 2012 were for additions to contract acquisition
costs, equipment, acquisitions, internally developed computer software and licensed computer software from
vendors.
Contract Acquisition Costs
TSYS makes cash payments for processing rights, third-party development costs and other direct salary-related
costs in connection with converting new customers to the Company’s processing systems. The Company’s
investments in contract acquisition costs were $88.9 million in 2014, $56.0 million in 2013 and $34.4 million in
2012. The Company made cash payments for processing rights of $21.7 million, $9.7 million and $14.4 million in
2014, 2013 and 2012, respectively. Conversion cost additions were $67.2 million, $46.3 million and $20.0 million
in 2014, 2013 and 2012, respectively. The increase in conversion costs in 2014 compared to 2013 and 2013
compared to 2012 is primarily related to the conversion of Bank of America’s consumer card portfolio.
Property and Equipment
Capital expenditures for property and equipment were $75.9 million in 2014, compared to $40.6 million in 2013
and $31.4 million in 2012. The majority of capital expenditures in 2014 related to computer processing hardware.
The majority of capital expenditures in 2013 related to investments in computer processing hardware and
building improvements. The majority of capital expenditures in 2012 related to computer processing hardware.
Internally Developed Computer Software Costs
Additions to capitalized software development costs, including enhancements to, and development of,
processing systems, were $41.5 million in 2014, $33.6 million in 2013, and $19.3 million in 2012. The increase in
capitalized software development costs in 2014 and 2013 was the result of two corporate-wide initiatives. One
initiative is a multi-year, multi-phase initiative that consists of enhancing TSYS’ issuing processing platforms. The
other is an innovation initiative focused on enhancing existing product and service offerings through several new
product concepts and ideas on how to change existing processes.
31