NetSpend 2014 Annual Report Download - page 29
Download and view the complete annual report
Please find page 29 of the 2014 NetSpend annual report below. You can navigate through the pages in the report by either clicking on the pages listed below, or by using the keyword search tool below to find specific information within the annual report.-
 1
1 -
2
-
3
-
4
-
5
-
6
-
7
-
8
-
9
-
10
-
11
-
12
-
13
-
14
-
15
-
16
-
17
-
18
-
 19
19 -
 20
20 -
 21
21 -
 22
22 -
 23
23 -
 24
24 -
 25
25 -
 26
26 -
 27
27 -
 28
28 -
 29
29 -
 30
30 -
 31
31 -
 32
32 -
 33
33 -
 34
34 -
 35
35 -
 36
36 -
 37
37 -
 38
38 -
 39
39 -
40
-
41
-
42
-
43
-
44
-
45
-
46
-
47
-
48
-
49
-
50
-
51
-
52
-
53
-
54
-
55
-
56
-
57
-
58
-
59
-
60
-
61
-
62
-
63
-
64
-
65
-
66
-
67
-
68
-
69
-
70
-
71
-
72
-
73
-
74
-
75
-
76
-
77
-
78
-
79
-
80
-
81
-
82
-
83
-
84
-
85
-
86
-
87
-
88
-
89
-
90
-
91
-
92
-
93
-
94
-
95
 |
 |

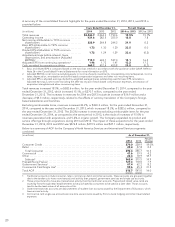
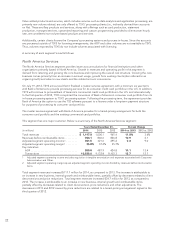
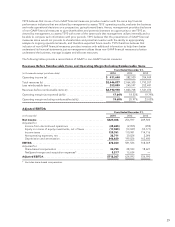
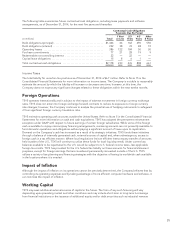
Below is a summary of the NetSpend segment:
Years Ended December 31, Percent Change
(millions) 2014 2013 2014 vs. 2013
Total revenues (and revenues before reimbursable items) ......... $ 482.7 207.9 nm
Adjusted segment operating income1......................... 128.3 66.4 nm
Adjusted segment operating margin2.......................... 26.6% 31.9%
Key indicators:
Number of active cards ................................... 3.2 2.8 13.4
Number of active cards with direct deposit ................... 1.6 1.3 21.9
Percentage of active cards with direct deposit ................ 50.1% 46.6%
Gross dollar volume ...................................... $20,296.0 7,748.5 nm
nm = not meaningful. Amounts are not comparable because the amounts for 2013 only include six months of results
compared to twelve months of results for 2014
1 Adjusted segment operating income excludes acquisition intangible amortization and expenses associated with Corporate
Administration and Other.
2 Adjusted segment operating margin equals adjusted segment operating income divided by revenues before reimbursable
items.
The results noted above for the year 2013 are for the period from July 1, 2013, the date that TSYS acquired
NetSpend, through December 31, 2013. Number of active cards represents the total number of prepaid cards
that have had a PIN or signature-based purchase transaction, a point-of-sale load transaction or an ATM
withdrawal within three months of the date of determination. Number of active cards with direct deposit
represents the number of active cards that have had a direct deposit load within three months of the date of
determination. Gross dollar volume represents the total dollar volume of debit transactions and cash withdrawals
made using the prepaid cards the NetSpend segment manages.
NetSpend segment revenues increased $274.8 million for 2014, as compared to 2013. This increase is
attributable mainly to the inclusion of a full twelve months of results in 2014. The $482.7 million of revenues for
2014 was a combination of 70.3% of revenues derived from fees charged to cardholders and 29.7% of revenues
derived from interchange and other revenues. The $207.9 million of revenue for 2013 was a combination of
74.9% of revenues derived from fees charged to cardholders and 25.1% of revenues derived from interchange
and other revenues. Service fee revenues are driven by the number of active cards which totaled approximately
3.2 million and 2.8 million as of December 31, 2014 and 2013, respectively, and in particular by the number of
cards with direct deposit. Cardholders with direct deposit generally initiate more transactions and generate more
revenues than those that do not take advantage of this feature. Interchange revenues are driven by gross dollar
volume, which totaled approximately $20.3 billion and $7.7 billion for the periods ended December 31, 2014 and
2013, respectively. Substantially all of the NetSpend segment revenues are volume driven as they are driven by
the active card and gross dollar volume indicators.
Cardholder funds and deposits related to NetSpend’s prepaid products are held at FDIC-insured Issuing Banks
for the benefit of the cardholders. NetSpend currently has active agreements with five Issuing Banks.
NetSpend’s prepaid card business derived approximately one-third of its revenues from cardholders acquired
through one of its third-party distributors.
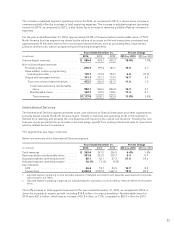
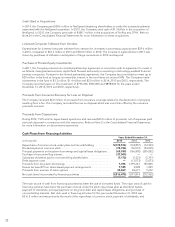
Operating Expenses
The Company’s operating expenses consist of cost of services and selling, general and administrative expenses.
Cost of services describes the direct expenses incurred in performing a particular service for customers, including
the cost of direct labor expense in putting the service in saleable condition. Selling, general and administrative
expenses are incurred in selling or marketing and for the direction of the enterprise as a whole, including
accounting, legal fees, officers’ salaries, investor relations and mergers and acquisitions.
The changes in cost of services, and selling, general and administrative expenses for the years ended
December 31, 2014 and 2013 include an increase of $5.9 million and a decrease of $16.9 million, respectively,
26