NetSpend 2014 Annual Report Download - page 26
Download and view the complete annual report
Please find page 26 of the 2014 NetSpend annual report below. You can navigate through the pages in the report by either clicking on the pages listed below, or by using the keyword search tool below to find specific information within the annual report.-
 1
1 -
2
-
3
-
4
-
5
-
6
-
7
-
8
-
9
-
10
-
11
-
12
-
13
-
14
-
15
-
 16
16 -
 17
17 -
 18
18 -
 19
19 -
 20
20 -
 21
21 -
 22
22 -
 23
23 -
 24
24 -
 25
25 -
 26
26 -
 27
27 -
 28
28 -
 29
29 -
 30
30 -
 31
31 -
 32
32 -
 33
33 -
 34
34 -
 35
35 -
 36
36 -
37
-
38
-
39
-
40
-
41
-
42
-
43
-
44
-
45
-
46
-
47
-
48
-
49
-
50
-
51
-
52
-
53
-
54
-
55
-
56
-
57
-
58
-
59
-
60
-
61
-
62
-
63
-
64
-
65
-
66
-
67
-
68
-
69
-
70
-
71
-
72
-
73
-
74
-
75
-
76
-
77
-
78
-
79
-
80
-
81
-
82
-
83
-
84
-
85
-
86
-
87
-
88
-
89
-
90
-
91
-
92
-
93
-
94
-
95
 |
 |

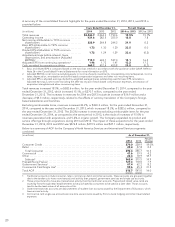
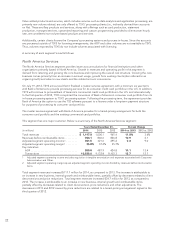
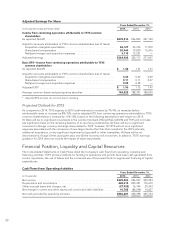
The increase in adjusted segment operating income for 2014, as compared to 2013, is driven by an increase in
revenues partially offset by increases in total operating expenses. The increase in adjusted segment operating
income for 2013, as compared to 2012, is also driven by an increase in revenues partially offset by increases in
expenses.
For the year ended December 31, 2014, approximately 50.4% of revenues before reimbursable items of TSYS’
North America Services segment are driven by the volume of accounts on file and transactions processed and
approximately 49.6% were derived from non-volume based revenues, such as processing fees, value-added
products and services, custom programming and licensing arrangements.
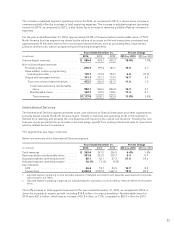
Years Ended December 31, Percent Change
(in millions) 2014 2013 2012 2014 vs. 2013 2013 vs. 2012
Volume-based revenues ................... $ 480.4 433.7 405.3 10.8% 7.0%
Non-volume related revenues:
Processing fees ......................... 216.7 195.4 183.1 10.9 6.7
Value-added, custom programming,
licensing and other .................... 115.7 110.4 124.1 4.8 (11.0)
Output and managed services ............ 141.3 121.1 114.3 16.7 5.9
Total non-volume related revenues ...... 473.7 426.9 421.5 11.0 1.3
Total revenues before reimbursable
items ........................... 954.1 860.6 826.8 10.9 4.1
Reimbursable items ................. 163.7 139.5 138.6 17.4 0.7
Total revenues .................... $1,117.8 1,000.1 965.4 11.8% 3.6%
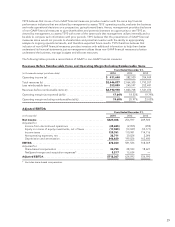
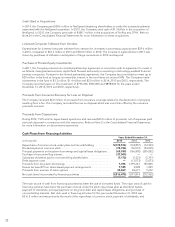
International Services
The International Services segment provides issuer card solutions to financial institutions and other organizations
primarily based outside the North America region. Growth in revenues and operating profit in this segment is
derived from retaining and growing the core business and improving the overall cost structure. Growing the core
business comes primarily from an increase in account usage, growth from existing clients and sales to new clients
and the related account conversions.
This segment has two major customers.
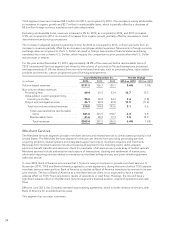
Below is a summary of the International Services segment:
Years Ended December 31, Percent Change
(in millions) 2014 2013 2012 2014 vs. 2013 2013 vs. 2012
Total revenues ........................... $ 363.4 341.5 336.0 6.4% 1.6%
Revenues before reimbursable items ......... 341.8 321.5 318.7 6.3 0.9
Adjusted segment operating income1........ 55.1 42.1 27.2 31.0 54.6
Adjusted segment operating margin2........ 16.1% 13.1% 8.5%
Key indicators:
AOF.................................. 66.6 59.1 54.5 12.7 8.5
Transactions ........................... 2,268.4 2,007.4 1,667.6 13.0 20.4
1 Adjusted segment operating income excludes acquisition intangible amortization and expenses associated with Corporate
Administration and Other.
2 Adjusted segment operating margin equals adjusted segment operating income divided by revenues before reimbursable
items.
The 6.4% increase in total segment revenues for the year ended December 31, 2014, as compared to 2013, is
driven by increases in organic growth, including $14.8 million of currency translation. Reimbursable items for
2014 were $21.6 million, which was an increase of $1.5 million, or 7.5%, compared to $20.0 million for 2013.
23