NetSpend 2014 Annual Report Download - page 31
Download and view the complete annual report
Please find page 31 of the 2014 NetSpend annual report below. You can navigate through the pages in the report by either clicking on the pages listed below, or by using the keyword search tool below to find specific information within the annual report.-
 1
1 -
2
-
3
-
4
-
5
-
6
-
7
-
8
-
9
-
10
-
11
-
12
-
13
-
14
-
15
-
16
-
17
-
18
-
19
-
20
-
 21
21 -
 22
22 -
 23
23 -
 24
24 -
 25
25 -
 26
26 -
 27
27 -
 28
28 -
 29
29 -
 30
30 -
 31
31 -
 32
32 -
 33
33 -
 34
34 -
 35
35 -
 36
36 -
 37
37 -
 38
38 -
 39
39 -
 40
40 -
 41
41 -
42
-
43
-
44
-
45
-
46
-
47
-
48
-
49
-
50
-
51
-
52
-
53
-
54
-
55
-
56
-
57
-
58
-
59
-
60
-
61
-
62
-
63
-
64
-
65
-
66
-
67
-
68
-
69
-
70
-
71
-
72
-
73
-
74
-
75
-
76
-
77
-
78
-
79
-
80
-
81
-
82
-
83
-
84
-
85
-
86
-
87
-
88
-
89
-
90
-
91
-
92
-
93
-
94
-
95
 |
 |
upon distribution was approximately $90.3 million as of December 31, 2014. Although TSYS does not intend to
repatriate these earnings, a distribution of these non-U.S. earnings in the form of dividends, or otherwise, would
subject the Company to both U.S. federal and state income taxes, as adjusted for non-U.S. tax credits, and
withholding taxes payable to the various non-U.S. countries. Determination of the amount of any unrecognized
deferred income tax liability on these undistributed earnings is not practicable.
In 2014, TSYS reassessed its contingencies for foreign, federal and state exposures, which resulted in a net
increase in tax contingency amounts of approximately $4.0 million.
Refer to Note 15 in the Consolidated Financial Statements for more information on income taxes.
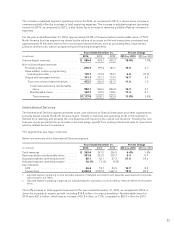
Equity in Income of Equity Investments
TSYS’ share of income from its equity in equity investments was $17.6 million, $13.0 million and $10.2 million for
2014, 2013 and 2012, respectively. The increase in equity income is the result of the growth in CUP Data. Refer
to Note 12 in the Consolidated Financial Statements for more information on equity investments.
Discontinued Operations
TSYS sold its Japan-based operations during 2014 and recorded income from discontinued operations, net of
tax, of $48.7 million, $2.1 million and $1.0 million for 2014, 2013 and 2012, respectively. All current and prior
period results and discussions exclude the impact of any Japan-based operations occurring during the respective
years. Refer to Note 2 in the Consolidated Financial Statements for more information on discontinued operations.
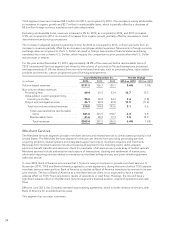
Net Income
Net income increased 28.4% to $329.4 million in 2014, compared to 2013. In 2013, net income increased 2.7%
to $256.6 million, compared to $249.9 million in 2012.
Net income attributable to noncontrolling interests in 2014 decreased to $6.5 million, as compared to $11.8
million in 2013 and $5.6 million in 2012. The decrease in 2014 was a result of the purchase of an additional 15%
equity interest in CPAY in 2014. The increase in 2013, as compared to 2012, was the result of a full year’s results
following the acquisition of 60% of CPAY in 2012.
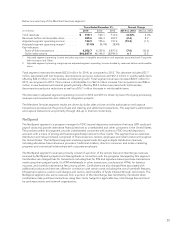
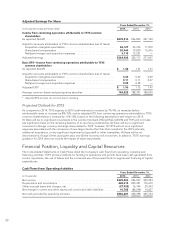
In 2014, net income attributable to TSYS common shareholders increased 31.9% to $322.9 million (basic and
diluted EPS of $1.73 and $1.72, respectively), compared to $244.8 million (basic and diluted EPS of $1.30 and
$1.29, respectively) in 2013. Net income attributable to TSYS common shareholders increased 0.2% in 2013,
compared to $244.3 million (basic and diluted EPS of $1.30 and $1.29, respectively) in 2012.
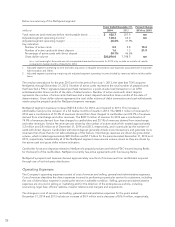
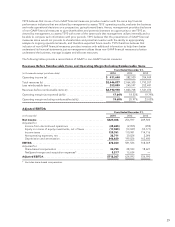
Non-GAAP Financial Measures
Management evaluates the Company’s operating performance based upon operating margin excluding
reimbursables, adjusted EPS and adjusted EBITDA, which are all non-generally accepted accounting principles
(non-GAAP) measures. TSYS also uses these non-GAAP financial measures to evaluate and assess TSYS’ financial
performance against budget.
Although not a substitute for GAAP, TSYS believes that non-GAAP financial measures are important to enable
investors to understand and evaluate its ongoing operating results. Accordingly, TSYS includes non-GAAP
financial measures when reporting its financial results to shareholders in order to provide them with an additional
tool to evaluate TSYS’ ongoing business operations. TSYS believes that the non-GAAP financial measures are
representative of comparative financial performance that reflects the economic substance of TSYS’ current and
ongoing business operations.
Although non-GAAP financial measures are often used to measure TSYS’ operating results and assess its financial
performance, they are not necessarily comparable to similarly titled captions of other companies due to potential
inconsistencies in the method of calculation.
28