NetSpend 2014 Annual Report Download - page 30
Download and view the complete annual report
Please find page 30 of the 2014 NetSpend annual report below. You can navigate through the pages in the report by either clicking on the pages listed below, or by using the keyword search tool below to find specific information within the annual report.-
 1
1 -
2
-
3
-
4
-
5
-
6
-
7
-
8
-
9
-
10
-
11
-
12
-
13
-
14
-
15
-
16
-
17
-
18
-
19
-
 20
20 -
 21
21 -
 22
22 -
 23
23 -
 24
24 -
 25
25 -
 26
26 -
 27
27 -
 28
28 -
 29
29 -
 30
30 -
 31
31 -
 32
32 -
 33
33 -
 34
34 -
 35
35 -
 36
36 -
 37
37 -
 38
38 -
 39
39 -
 40
40 -
41
-
42
-
43
-
44
-
45
-
46
-
47
-
48
-
49
-
50
-
51
-
52
-
53
-
54
-
55
-
56
-
57
-
58
-
59
-
60
-
61
-
62
-
63
-
64
-
65
-
66
-
67
-
68
-
69
-
70
-
71
-
72
-
73
-
74
-
75
-
76
-
77
-
78
-
79
-
80
-
81
-
82
-
83
-
84
-
85
-
86
-
87
-
88
-
89
-
90
-
91
-
92
-
93
-
94
-
95
 |
 |
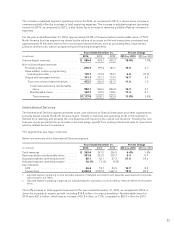
related to the effects of currency translation of the Company’s foreign-based subsidiaries and branches along
with increases in expense due to the NetSpend acquisition and a significant nonrecurring charitable contribution
in the fourth quarter of 2014. The impact of acquisitions on operating expenses was $238.3 million in 2014,
$217.4 million in 2013, and $20.0 million in 2012.
Federal legislation was enacted which made extensive changes to the system of health care insurance and
benefits. The Company estimates the legislation increased expenses in the years ended 2014, 2013, and 2012 by
approximately $1.8 million, $1.1 million and $600,000 respectively.
The Company’s merger and acquisition expenses were $3.2 million, $14.2 million and $1.7 million for the years
ended December 31, 2014, 2013 and 2012, respectively. These expenses consist of legal, accounting and
professional fees, as well as, personnel costs for severance and retention.
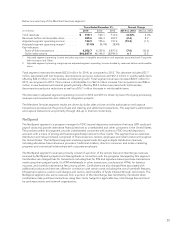
Nonoperating Income (Expense)
Nonoperating income (expense) consists of interest income, interest expense, gains and losses on currency
translations and gains and losses on investments in private equity. Nonoperating income (expense) decreased in
2014 as compared to 2013, and decreased in 2013 as compared to 2012.
Interest income for 2014 and 2013 was $1.1 million and $1.5 million, respectively, a decrease of 25.8%. Interest
income in 2012 was $1.5 million. The variation in interest income is primarily attributable to changes in short-term
interest rates in 2014 and 2013 and the amount of cash available for investments.
Interest expense for the year ended December 31, 2014 was $41.0 million, an $8.6 million increase when
compared to $32.4 million in 2013. The interest expense on the bonds for the year ended December 31, 2014
was $33.7 million. The $32.4 million of interest expense for the year ended December 31, 2013 was a $29.5
million increase when compared to $2.9 million in 2012. The Company’s interest expense related to a bridge loan
facility and bonds was $5.9 million and $20.0 million, respectively, for the year ended December 31, 2013. These
expenses were related to financing the NetSpend acquisition.
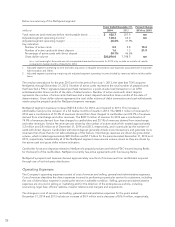
For the years ended December 31, 2014, 2013 and 2012, the Company recorded a translation gain of
approximately $142,000 and translation losses of approximately $1.0 million and $2.1 million, respectively,
related to intercompany loans and foreign denominated cash and accounts receivable balances.
The Company recorded gains on its investments in private equity of $793,000, $966,000 and $898,000 for the
years ended December 31, 2014, 2013 and 2012, respectively, due to changes in fair value.
Income Taxes
Income tax expense was $129.8 million, $111.0 million, and $114.1 million in 2014, 2013 and 2012, respectively,
representing effective income tax rates of 32.0%, 31.5%, and 31.9%, respectively. The calculation of the effective
tax rate excludes noncontrolling interest in consolidated subsidiaries’ net income and includes equity in income
of equity investments in pretax income.
During 2014, the Company generated income tax credits in excess of its utilization capacity based on both the
Company’s current operations and with consideration of future tax planning strategies. Based upon these same
considerations, the Company reassessed its need for valuation allowances in all jurisdictions. Accordingly, the
Company experienced a net increase in its valuation allowance for deferred income tax assets of $4.3 million.
TSYS has adopted the permanent reinvestment exception as allowed by GAAP, with respect to future earnings of
certain foreign subsidiaries. As a result, TSYS considers foreign earnings related to these foreign operations to be
permanently reinvested. No provision for U.S. federal and state incomes taxes has been made in the
Consolidated Financial Statements for those non-U.S. subsidiaries whose earnings are considered to be
reinvested. The amount of undistributed earnings considered to be “reinvested” which may be subject to tax
27