NetSpend 2014 Annual Report Download - page 33
Download and view the complete annual report
Please find page 33 of the 2014 NetSpend annual report below. You can navigate through the pages in the report by either clicking on the pages listed below, or by using the keyword search tool below to find specific information within the annual report.-
 1
1 -
2
-
3
-
4
-
5
-
6
-
7
-
8
-
9
-
10
-
11
-
12
-
13
-
14
-
15
-
16
-
17
-
18
-
19
-
20
-
21
-
22
-
 23
23 -
 24
24 -
 25
25 -
 26
26 -
 27
27 -
 28
28 -
 29
29 -
 30
30 -
 31
31 -
 32
32 -
 33
33 -
 34
34 -
 35
35 -
 36
36 -
 37
37 -
 38
38 -
 39
39 -
 40
40 -
 41
41 -
 42
42 -
 43
43 -
44
-
45
-
46
-
47
-
48
-
49
-
50
-
51
-
52
-
53
-
54
-
55
-
56
-
57
-
58
-
59
-
60
-
61
-
62
-
63
-
64
-
65
-
66
-
67
-
68
-
69
-
70
-
71
-
72
-
73
-
74
-
75
-
76
-
77
-
78
-
79
-
80
-
81
-
82
-
83
-
84
-
85
-
86
-
87
-
88
-
89
-
90
-
91
-
92
-
93
-
94
-
95
 |
 |

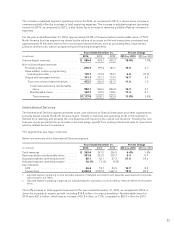
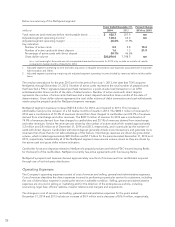
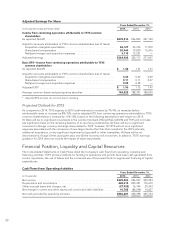
Adjusted Earnings Per Share
Years Ended December 31,
(in thousands except per share data) 2014 2013 2012
Income from continuing operations attributable to TSYS common
shareholders
As reported (GAAP) .................................................. $275,216 246,893 247,149
Adjust for amounts attributable to TSYS common shareholders (net of taxes):
Acquisition intangible amortization .................................... 65,127 43,743 17,272
Share-based compensation .......................................... 20,944 19,830 12,676
NetSpend merger and acquisition expenses ............................ 3,115 15,251 —
Adjusted earnings .................................................... $364,402 325,717 277,097
Basic EPS—Income from continuing operations attributable to TSYS
common shareholders
As reported (GAAP) .................................................. $ 1.48 1.31 1.31
Adjust for amounts attributable to TSYS common shareholders (net of taxes):
Acquisition intangible amortization .................................... 0.35 0.23 0.09
Share-based compensation .......................................... 0.11 0.11 0.07
NetSpend merger and acquisition expenses ............................ 0.02 0.08 —
Adjusted EPS* ....................................................... $ 1.96 1.73 1.47
Average common shares and participating securities ....................... 186,222 188,391 188,030
* Adjusted EPS amounts do not total due to rounding.
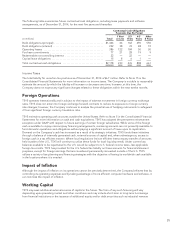
Projected Outlook for 2015
As compared to 2014, TSYS expects its 2015 total revenues to increase by 7%-9%, its revenues before
reimbursable items to increase by 8%-10%, and its adjusted EPS from continuing operations attributable to TSYS
common shareholders to increase by 11%-13%, based on the following assumptions with respect to 2015:
(1) there will be no significant movements in the London Interbank Offered Rate (LIBOR) and TSYS will not make
any significant draws on the remaining balance of its revolving credit facility; (2) there will be no significant
movement in foreign currency exchange rates related to TSYS’ business; (3) TSYS will not incur significant
expenses associated with the conversion of new large clients other than that included in the 2015 estimate,
additional acquisitions, or any significant impairment of goodwill or other intangibles; (4) there will be no
deconversions of large clients during the year; and (5) the economy will not worsen. In addition, TSYS’ earnings
guidance for 2015 does not include the impact of share repurchases.
Financial Position, Liquidity and Capital Resources
The Consolidated Statements of Cash Flows detail the Company’s cash flows from operating, investing and
financing activities. TSYS’ primary methods for funding its operations and growth have been cash generated from
current operations, the use of leases and the occasional use of borrowed funds to supplement financing of capital
expenditures.
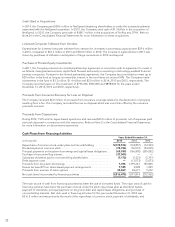
Cash Flows from Operating Activities
Years Ended December 31,
(in thousands) 2014 2013 2012
Net income ......................................................... $329,406 256,597 249,923
Depreciation and amortization ......................................... 248,018 205,351 170,610
Other noncash items and charges, net ................................... (27,928) 76,744 20,593
Net change in current and other assets and current and other liabilities ....... 10,705 (86,294) 14,627
Net cash provided by operating activities ................................ $560,201 452,398 455,753
30