Lexmark 2011 Annual Report Download - page 92
Download and view the complete annual report
Please find page 92 of the 2011 Lexmark annual report below. You can navigate through the pages in the report by either clicking on the pages listed below, or by using the keyword search tool below to find specific information within the annual report.-
 1
1 -
2
-
3
-
4
-
5
-
6
-
7
-
8
-
9
-
10
-
11
-
12
-
13
-
14
-
15
-
16
-
17
-
18
-
19
-
20
-
21
-
22
-
23
-
24
-
25
-
26
-
27
-
28
-
29
-
30
-
31
-
32
-
33
-
34
-
35
-
36
-
37
-
38
-
39
-
40
-
41
-
42
-
43
-
44
-
45
-
46
-
47
-
48
-
49
-
50
-
51
-
52
-
53
-
54
-
55
-
56
-
57
-
58
-
59
-
60
-
61
-
62
-
63
-
64
-
65
-
66
-
67
-
68
-
69
-
70
-
71
-
72
-
73
-
74
-
75
-
76
-
77
-
78
-
79
-
80
-
81
-
 82
82 -
 83
83 -
 84
84 -
 85
85 -
 86
86 -
 87
87 -
 88
88 -
 89
89 -
 90
90 -
 91
91 -
 92
92 -
 93
93 -
 94
94 -
 95
95 -
 96
96 -
 97
97 -
 98
98 -
 99
99 -
 100
100 -
 101
101 -
 102
102 -
103
-
104
-
105
-
106
-
107
-
108
-
109
-
110
-
111
-
112
-
113
-
114
-
115
-
116
-
117
-
118
-
119
-
120
-
121
-
122
-
123
-
124
-
125
-
126
-
127
-
128
-
129
-
130
-
131
-
132
-
133
-
134
-
135
-
136
-
137
-
138
-
139
-
140
-
141
-
142
-
143
-
144
-
145
-
146
-
147
-
148
-
149
-
150
-
151
-
152
-
153
-
154
-
155
-
156
-
157
-
158
-
159
-
160
-
161
-
162
-
163
-
164
 |
 |
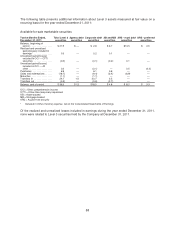
The following table presents additional information about Level 3 assets measured at fair value on a
recurring basis for the year ended December 31, 2011:
Available-for-sale marketable securities
Twelve Months Ended,
December 31, 2011
Total Level 3
securities
Agency debt
securities
Corporate debt
securities
AB and MB
securities
ARS - muni debt
securities
ARS - preferred
securities
Balance, beginning of
period .................. $27.5 $ — $ 2.8 $ 6.7 $14.5 $ 3.5
Realized and unrealized
gains/(losses) included in
earnings* ............... 0.3 — 0.2 0.1 — —
Unrealized gains/(losses)
included in OCI — OTTI
securities ............... (0.2) — (0.1) (0.2) 0.1 —
Unrealized gains/(losses)
included in OCI — All
other ................... 0.2 — (0.1) — 0.5 (0.2)
Purchases ................ 6.9 — 6.1 0.8 — —
Sales and redemptions ...... (18.7) — (9.4) (2.4) (6.9) —
Maturities ................. (1.1) — (1.1) — — —
Transfers in ............... 24.7 1.5 20.7 2.5 — —
Transfers out .............. (3.3) — (0.6) (2.7) — —
Balance, end of period ...... $36.3 $1.5 $18.5 $ 4.8 $ 8.2 $ 3.3
OCI = Other comprehensive income
OTTI = Other-than-temporary impairment
AB = Asset-backed
MB = Mortgage-backed
ARS = Auction rate security
* Included in Other (income) expense, net on the Consolidated Statements of Earnings
Of the realized and unrealized losses included in earnings during the year ended December 31, 2011,
none were related to Level 3 securities held by the Company at December 31, 2011.
88