Lexmark 2011 Annual Report Download - page 107
Download and view the complete annual report
Please find page 107 of the 2011 Lexmark annual report below. You can navigate through the pages in the report by either clicking on the pages listed below, or by using the keyword search tool below to find specific information within the annual report.
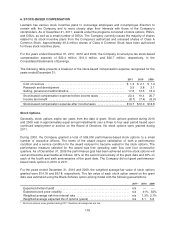
6. STOCK-BASED COMPENSATION
Lexmark has various stock incentive plans to encourage employees and nonemployee directors to
remain with the Company and to more closely align their interests with those of the Company’s
stockholders. As of December 31, 2011, awards under the programs consisted of stock options, RSUs,
and DSUs, as well as a small number of DEUs. The Company currently issues the majority of shares
related to its stock incentive plans from the Company’s authorized and unissued shares of Class A
Common Stock. Approximately 49.3 million shares of Class A Common Stock have been authorized
for these stock incentive plans.
For the years ended December 31, 2011, 2010 and 2009, the Company incurred pre-tax stock-based
compensation expense of $22.4 million, $19.4 million, and $20.7 million, respectively, in the
Consolidated Statements of Earnings.
The following table presents a breakout of the stock-based compensation expense recognized for the
years ended December 31:
2011 2010 2009
Cost of revenue ................................................... $ 1.3 $ 2.1 $ 1.3
Research and development ......................................... 3.5 3.8 3.1
Selling, general and administrative ................................... 17.6 13.5 16.3
Stock-based compensation expense before income taxes ................ 22.4 19.4 20.7
Income tax benefit ................................................ (8.7) (7.4) (6.9)
Stock-based compensation expense after income taxes ................. $13.7 $12.0 $13.8
Stock Options
Generally, stock options expire ten years from the date of grant. Stock options granted during 2010
and 2009 vest in approximately equal annual installments over a three to four year period based upon
continued employment or service on the Board of Directors. No stock options were granted during
2011.
During 2009, the Company granted a total of 559,000 performance-based stock options to a small
number of executive officers. The terms of the award require satisfaction of both a performance
condition and a service condition for the award recipient to become vested in the stock options. The
performance measure selected for the award was free operating cash flow over four consecutive
quarters. As of December 31, 2009 the performance goal had been achieved and the stock options will
vest and become exercisable as follows: 34% on the second anniversary of the grant date and 33% on
each of the fourth and sixth anniversaries of the grant date. The Company did not grant performance-
based stock options in 2010 or 2011.
For the years ended December 31, 2010 and 2009, the weighted average fair value of stock options
granted were $14.18 and $6.18, respectively. The fair value of each stock option award on the grant
date was estimated using the Black-Scholes option-pricing model with the following assumptions:
2011* 2010 2009
Expected dividend yield ................................................ n/a — —
Expected stock price volatility ........................................... n/a 41% 35%
Weighted average risk-free interest rate .................................. n/a 1.3% 2.1%
Weighted average expected life of options (years) .......................... n/a 5.1 5.6
* No stock options were granted during 2011 therefore all categories are n/a.
103


