Lexmark 2011 Annual Report Download - page 111
Download and view the complete annual report
Please find page 111 of the 2011 Lexmark annual report below. You can navigate through the pages in the report by either clicking on the pages listed below, or by using the keyword search tool below to find specific information within the annual report.-
 1
1 -
2
-
3
-
4
-
5
-
6
-
7
-
8
-
9
-
10
-
11
-
12
-
13
-
14
-
15
-
16
-
17
-
18
-
19
-
20
-
21
-
22
-
23
-
24
-
25
-
26
-
27
-
28
-
29
-
30
-
31
-
32
-
33
-
34
-
35
-
36
-
37
-
38
-
39
-
40
-
41
-
42
-
43
-
44
-
45
-
46
-
47
-
48
-
49
-
50
-
51
-
52
-
53
-
54
-
55
-
56
-
57
-
58
-
59
-
60
-
61
-
62
-
63
-
64
-
65
-
66
-
67
-
68
-
69
-
70
-
71
-
72
-
73
-
74
-
75
-
76
-
77
-
78
-
79
-
80
-
81
-
82
-
83
-
84
-
85
-
86
-
87
-
88
-
89
-
90
-
91
-
92
-
93
-
94
-
95
-
96
-
97
-
98
-
99
-
100
-
 101
101 -
 102
102 -
 103
103 -
 104
104 -
 105
105 -
 106
106 -
 107
107 -
 108
108 -
 109
109 -
 110
110 -
 111
111 -
 112
112 -
 113
113 -
 114
114 -
 115
115 -
 116
116 -
 117
117 -
 118
118 -
 119
119 -
 120
120 -
 121
121 -
122
-
123
-
124
-
125
-
126
-
127
-
128
-
129
-
130
-
131
-
132
-
133
-
134
-
135
-
136
-
137
-
138
-
139
-
140
-
141
-
142
-
143
-
144
-
145
-
146
-
147
-
148
-
149
-
150
-
151
-
152
-
153
-
154
-
155
-
156
-
157
-
158
-
159
-
160
-
161
-
162
-
163
-
164
 |
 |

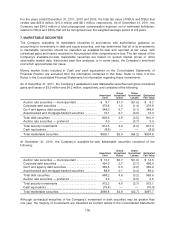
of Financial Position due to the Company’s ability to use these investments for current liquidity needs if
required. As of December 31, 2011 and 2010, auction rate securities of $11.5 million and $18.0 million,
respectively, are classified in noncurrent assets due to the fact that the securities have experienced
unsuccessful auctions and that poor debt market conditions have reduced the likelihood that the
securities will successfully auction within the next 12 months. The contractual maturities of the
Company’s available-for-sale marketable securities noted above are shown below. Expected maturities
may differ from contractual maturities for certain securities that allow for call or prepayment provisions.
Proceeds from calls and prepayments are included in Proceeds from maturities of marketable
securities on the Consolidated Statements of Cash Flows.
2011 2010
Amortized
Cost
Estimated
Fair Value
Amortized
Cost
Estimated
Fair Value
Due in less than one year .......................... $199.6 $199.9 $279.9 $280.2
Due in 1-5 years ................................. 590.1 590.5 645.5 647.5
Due after 5 years ................................ 23.9 22.9 46.8 45.4
Total available-for-sale marketable securities .......... $813.6 $813.3 $972.2 $973.1
For the year ended December 31, 2011, the Company recognized $3.2 million in net gains on its
marketable securities, all of which is realized gains due to sales and maturities and is included in Other
(income) expense, net on the Consolidated Statements of Earnings. The Company uses the specific
identification method when accounting for the costs of its available-for-sale marketable securities sold.
For the year ended December 31, 2010, the Company recognized $2.9 million in net gains on its
marketable securities, of which $3.2 million is net realized gains included in Other (income) expense,
net on the Consolidated Statements of Earnings, and $0.3 million is recognized as other-than-
temporary impairment due to credit related losses and is included in Net impairment losses on
securities on the Consolidated Statements of Earnings.
For the year ended December 31, 2009, the Company recognized $2.7 million in net losses on its
marketable securities, of which $0.4 million was net realized gains included in Other (income) expense,
net on the Consolidated Statements of Earnings, and $3.1 million was recognized as other-than-
temporary impairment due to credit related losses and is included in Net impairment losses on securities
on the Consolidated Statements of Earnings. The $0.4 million net realized gain included a $0.2 million
loss recognized in earnings as other-than-temporary impairment in the first quarter of 2009. The
$0.2 million loss was included in Other (income) expense, net on the Consolidated Statements of
Earnings as the Company did not adopt the provisions of the amended FASB guidance on recognition
and presentation of other-than-temporary impairments until April 1, 2009 as permitted by the guidance.
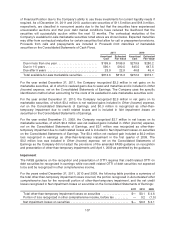
Impairment
The FASB guidance on the recognition and presentation of OTTI requires that credit related OTTI on
debt securities be recognized in earnings while noncredit related OTTI of debt securities not expected
to be sold be recognized in other comprehensive income.
For the years ended December 31, 2011, 2010 and 2009, the following table provides a summary of
the total other-than-temporary impairment losses incurred, the portion recognized in Accumulated other
comprehensive loss for the noncredit portion of other-than-temporary impairment, and the net credit
losses recognized in Net impairment losses on securities on the Consolidated Statements of Earnings:
2011 2010 2009
Total other-than-temporary impairment losses on securities ................. $— $0.1 $ 4.6
Portion of loss recognized in other comprehensive income, before tax ......... — 0.2 (1.5)
Net impairment losses on securities ..................................... $— $0.3 $ 3.1
107