Lexmark 2011 Annual Report Download - page 128
Download and view the complete annual report
Please find page 128 of the 2011 Lexmark annual report below. You can navigate through the pages in the report by either clicking on the pages listed below, or by using the keyword search tool below to find specific information within the annual report.-
 1
1 -
2
-
3
-
4
-
5
-
6
-
7
-
8
-
9
-
10
-
11
-
12
-
13
-
14
-
15
-
16
-
17
-
18
-
19
-
20
-
21
-
22
-
23
-
24
-
25
-
26
-
27
-
28
-
29
-
30
-
31
-
32
-
33
-
34
-
35
-
36
-
37
-
38
-
39
-
40
-
41
-
42
-
43
-
44
-
45
-
46
-
47
-
48
-
49
-
50
-
51
-
52
-
53
-
54
-
55
-
56
-
57
-
58
-
59
-
60
-
61
-
62
-
63
-
64
-
65
-
66
-
67
-
68
-
69
-
70
-
71
-
72
-
73
-
74
-
75
-
76
-
77
-
78
-
79
-
80
-
81
-
82
-
83
-
84
-
85
-
86
-
87
-
88
-
89
-
90
-
91
-
92
-
93
-
94
-
95
-
96
-
97
-
98
-
99
-
100
-
101
-
102
-
103
-
104
-
105
-
106
-
107
-
108
-
109
-
110
-
111
-
112
-
113
-
114
-
115
-
116
-
117
-
 118
118 -
 119
119 -
 120
120 -
 121
121 -
 122
122 -
 123
123 -
 124
124 -
 125
125 -
 126
126 -
 127
127 -
 128
128 -
 129
129 -
 130
130 -
 131
131 -
 132
132 -
 133
133 -
 134
134 -
 135
135 -
 136
136 -
 137
137 -
 138
138 -
139
-
140
-
141
-
142
-
143
-
144
-
145
-
146
-
147
-
148
-
149
-
150
-
151
-
152
-
153
-
154
-
155
-
156
-
157
-
158
-
159
-
160
-
161
-
162
-
163
-
164
 |
 |

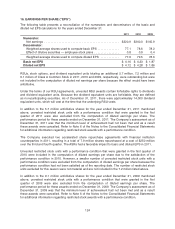
16. EARNINGS PER SHARE (“EPS”)
The following table presents a reconciliation of the numerators and denominators of the basic and
diluted net EPS calculations for the years ended December 31:
2011 2010 2009
Numerator:
Net earnings ................................................ $320.9 $340.0 $145.9
Denominator:
Weighted average shares used to compute basic EPS .............. 77.1 78.6 78.2
Effect of dilutive securities — employee stock plans ................ 0.8 0.9 0.4
Weighted average shares used to compute diluted EPS ............ 77.9 79.5 78.6
Basic net EPS $ 4.16 $ 4.33 $ 1.87
Diluted net EPS $ 4.12 $ 4.28 $ 1.86
RSUs, stock options, and dividend equivalent units totaling an additional 5.7 million, 7.2 million and
9.1 million of Class A Common Stock in 2011, 2010 and 2009, respectively, were outstanding but were
not included in the computation of diluted net earnings per share because the effect would have been
antidilutive.
Under the terms of our RSU agreements, unvested RSU awards contain forfeitable rights to dividends
and dividend equivalent units. Because the dividend equivalent units are forfeitable, they are defined
as non-participating securities. As of December 31, 2011, there were approximately 14,000 dividend
equivalent units, which will vest at the time that the underlying RSU vests.
In addition to the 5.7 million antidilutive shares for the year ended December 31, 2011 mentioned
above, unvested restricted stock units with a performance condition that were granted in the first
quarter of 2011 were also excluded from the computation of diluted earnings per share. The
performance period for these awards ended on December 31, 2011. The Company’s assessment as of
December 31, 2011 was that the minimum level of achievement had not been met and as a result
these awards were cancelled. Refer to Note 6 of the Notes to the Consolidated Financial Statements
for additional information regarding restricted stock awards with a performance condition.
The Company executed two accelerated share repurchase agreements with financial institution
counterparties in 2011, resulting in a total of 7.9 million shares repurchased at a cost of $250 million
over the third and fourth quarter. The ASRs had a favorable impact to basic and diluted EPS in 2011.
Unvested restricted stock units with a performance condition that were granted in the first quarter of
2010 were included in the computation of diluted earnings per share due to the satisfaction of the
performance condition in 2010. However, a smaller number of unvested restricted stock units with a
performance condition were excluded from the computation of diluted earnings per share because the
performance condition had not been satisfied as of the reporting date. The number of restricted stock
units excluded for this reason were not material and are not included in the 7.2 million listed above.
In addition to the 9.1 million antidilutive shares for the year ended December 31, 2009 mentioned
above, unvested restricted stock units with a performance condition that were granted in the first
quarter of 2009 were also excluded from the computation of diluted earnings per share. The
performance period for these awards ended on December 31, 2009. The Company’s assessment as of
December 31, 2009 was that the minimum level of achievement had not been met and as a result
these awards were cancelled. Refer to Note 6 of the Notes to the Consolidated Financial Statements
for additional information regarding restricted stock awards with a performance condition.
124