Lexmark 2011 Annual Report Download - page 100
Download and view the complete annual report
Please find page 100 of the 2011 Lexmark annual report below. You can navigate through the pages in the report by either clicking on the pages listed below, or by using the keyword search tool below to find specific information within the annual report.-
 1
1 -
2
-
3
-
4
-
5
-
6
-
7
-
8
-
9
-
10
-
11
-
12
-
13
-
14
-
15
-
16
-
17
-
18
-
19
-
20
-
21
-
22
-
23
-
24
-
25
-
26
-
27
-
28
-
29
-
30
-
31
-
32
-
33
-
34
-
35
-
36
-
37
-
38
-
39
-
40
-
41
-
42
-
43
-
44
-
45
-
46
-
47
-
48
-
49
-
50
-
51
-
52
-
53
-
54
-
55
-
56
-
57
-
58
-
59
-
60
-
61
-
62
-
63
-
64
-
65
-
66
-
67
-
68
-
69
-
70
-
71
-
72
-
73
-
74
-
75
-
76
-
77
-
78
-
79
-
80
-
81
-
82
-
83
-
84
-
85
-
86
-
87
-
88
-
89
-
 90
90 -
 91
91 -
 92
92 -
 93
93 -
 94
94 -
 95
95 -
 96
96 -
 97
97 -
 98
98 -
 99
99 -
 100
100 -
 101
101 -
 102
102 -
 103
103 -
 104
104 -
 105
105 -
 106
106 -
 107
107 -
 108
108 -
 109
109 -
 110
110 -
111
-
112
-
113
-
114
-
115
-
116
-
117
-
118
-
119
-
120
-
121
-
122
-
123
-
124
-
125
-
126
-
127
-
128
-
129
-
130
-
131
-
132
-
133
-
134
-
135
-
136
-
137
-
138
-
139
-
140
-
141
-
142
-
143
-
144
-
145
-
146
-
147
-
148
-
149
-
150
-
151
-
152
-
153
-
154
-
155
-
156
-
157
-
158
-
159
-
160
-
161
-
162
-
163
-
164
 |
 |

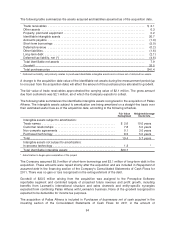
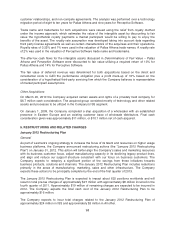
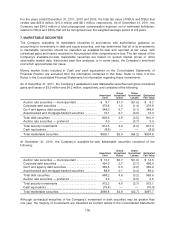
The following table summarizes the assets acquired and liabilities assumed as of the acquisition date
including the effect of measurement period adjustments recorded in 2011 and 2010 as discussed
below.
Cash ........................................................................ $ 13.2
Trade receivables ............................................................. 26.2
Other assets ................................................................. 5.1
Property, plant and equipment ................................................... 3.5
Identifiable intangible assets .................................................... 145.9
Deferred tax liability, net (*) ..................................................... (53.2)
Accounts payable ............................................................. (2.5)
Deferred revenue ............................................................. (2.4)
Long-term debt ............................................................... (3.1)
Other liabilities ................................................................ (14.5)
Total identifiable net assets ..................................................... 118.2
Goodwill ..................................................................... 161.8
Total purchase price ........................................................... $280.0
*Deferred tax liability, net primarily relates to purchased identifiable intangible assets and is shown net of deferred tax assets.
A change to the acquisition date value of the identifiable net assets during the measurement period (up
to one year from the acquisition date) affects the amount of the purchase price allocated to goodwill.
Changes to the purchase price allocation are adjusted retrospectively to the consolidated financial
results. The values above include a measurement period adjustment recorded in 2011 affecting
Goodwill $2.2 million and Deferred tax liability, net $(2.2) million. The values above also include
measurement period adjustments recorded in 2010 subsequent to the acquisition affecting Other
assets $2.5 million, Deferred tax liability, net $(5.2) million, Other liabilities $(2.3) million, and Goodwill
$5.0 million. The measurement period adjustments were recorded based on information obtained
subsequent to the acquisition related to certain income tax matters contemplated by the Company at
the acquisition date. The December 31, 2010 balances for Goodwill and Other assets on the
Consolidated Statements of Financial Position have been revised to include the effect of the
measurement period adjustment recorded in 2011.
The fair value of trade receivables approximates its carrying value of $26.2 million. The gross amount
due from customers is $27.7 million, of which $1.5 million is estimated to be uncollectible.
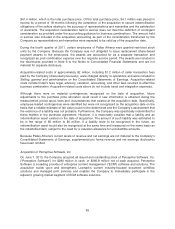
The following table summarizes the identifiable intangible assets recognized in the acquisition of
Perceptive Software. The intangible assets subject to amortization are being amortized on a straight-line
basis over their estimated useful lives as of the acquisition date, according to the following schedule.
Fair Value
Recognized
Weighted-Average
Useful Life
Intangible assets subject to amortization:
Customer relationships ....................................... $ 35.8 8.0 years
Non-compete agreements .................................... 1.6 3.0years
Purchased technology ....................................... 74.3 5.0 years
Total ...................................................... 111.7 5.9 years
Intangible assets not subject to amortization:
In-process technology ........................................ 1.9 *
Trade names and trademarks ................................. 32.3 N/A
Total ...................................................... 34.2
Total identifiable intangible assets .............................. $145.9
* The in-process technology was not subject to amortization at the acquisition date, but began amortizing upon completion of the
project in the first quarter of 2011, over a 5 year estimated useful life.
96