Lexmark 2011 Annual Report Download - page 127
Download and view the complete annual report
Please find page 127 of the 2011 Lexmark annual report below. You can navigate through the pages in the report by either clicking on the pages listed below, or by using the keyword search tool below to find specific information within the annual report.-
 1
1 -
2
-
3
-
4
-
5
-
6
-
7
-
8
-
9
-
10
-
11
-
12
-
13
-
14
-
15
-
16
-
17
-
18
-
19
-
20
-
21
-
22
-
23
-
24
-
25
-
26
-
27
-
28
-
29
-
30
-
31
-
32
-
33
-
34
-
35
-
36
-
37
-
38
-
39
-
40
-
41
-
42
-
43
-
44
-
45
-
46
-
47
-
48
-
49
-
50
-
51
-
52
-
53
-
54
-
55
-
56
-
57
-
58
-
59
-
60
-
61
-
62
-
63
-
64
-
65
-
66
-
67
-
68
-
69
-
70
-
71
-
72
-
73
-
74
-
75
-
76
-
77
-
78
-
79
-
80
-
81
-
82
-
83
-
84
-
85
-
86
-
87
-
88
-
89
-
90
-
91
-
92
-
93
-
94
-
95
-
96
-
97
-
98
-
99
-
100
-
101
-
102
-
103
-
104
-
105
-
106
-
107
-
108
-
109
-
110
-
111
-
112
-
113
-
114
-
115
-
116
-
 117
117 -
 118
118 -
 119
119 -
 120
120 -
 121
121 -
 122
122 -
 123
123 -
 124
124 -
 125
125 -
 126
126 -
 127
127 -
 128
128 -
 129
129 -
 130
130 -
 131
131 -
 132
132 -
 133
133 -
 134
134 -
 135
135 -
 136
136 -
 137
137 -
138
-
139
-
140
-
141
-
142
-
143
-
144
-
145
-
146
-
147
-
148
-
149
-
150
-
151
-
152
-
153
-
154
-
155
-
156
-
157
-
158
-
159
-
160
-
161
-
162
-
163
-
164
 |
 |

drivers of the favorable change in 2010 were increases in the exchange rate values of 5.4% in the
Philippine peso, 6.1% in the Mexican peso, 5.0% in the Brazilian real, 14.0% in the Australian dollar,
and 11.6% in the South African rand; these increases were partially offset by a 6.5% decrease in the
Euro exchange rate. The largest factor behind the favorable movement in 2009 was the 32.7%
increase in the Brazilian real exchange rate.
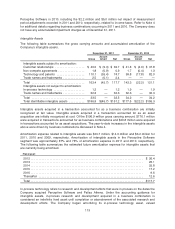
The unfavorable change of $49.5 million in the 2011 Pension or other postretirement benefits was
primarily due to decreases in discount rates and lower than expected returns on plan assets. Refer to
Note 17 of the Notes to Consolidated Financial Statements for additional information regarding pension
and other postretirement plans, including the amounts amortized out of Accumulated other
comprehensive (loss) earnings into net periodic benefit cost for the periods presented.
The 2011 activity in Net unrealized gain (loss) on marketable securities includes the $(0.3) million
reclassification, pre-tax, of gains out of Accumulated other comprehensive (loss) earnings into net
income upon the sale or redemption of debt securities during the period. The 2010 activity in Net
unrealized gain (loss) on marketable securities includes the $(2.1) million reclassification, pre-tax, of
gains out of Accumulated other comprehensive (loss) earnings into net income upon the sale or
redemption of debt securities during the period.
In 2011 and 2010, the reclassification adjustment, pre-tax, related to OTTI marketable securities was
immaterial. The 2009 activity in Net unrealized gain (loss) on OTTI marketable securities was driven by
credit losses of $1.4 million, net of tax, that were recycled to Net earnings during the year. Earlier in
2009, the Company recorded a cumulative effect adjustment to Accumulated other comprehensive
(loss) earnings in the amount of $(1.7) million, net of tax, related to the adoption of new accounting
guidance regarding OTTI of marketable debt securities.
Refer to Note 7 of the Notes to Consolidated Financial Statements for additional information regarding
the Company’s marketable securities.
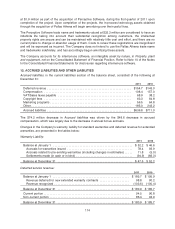
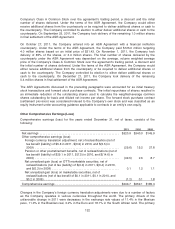
Accumulated other comprehensive (loss) earnings for the years ended December 31 consists of the
following:
Foreign
Currency
Translation
Adjustment
Pension or
Other
Postretirement
Benefits
Net Unrealized
Gain (Loss) on
Marketable
Securities - OTTI
Net
Unrealized
(Loss) Gain
on
Marketable
Securities
Accumulated
Other
Comprehensive
(Loss) Earnings
Balance at 12/31/08 ...... $(33.8) $(245.2) $ — $(1.3) $(280.3)
Adoption of OTTI
guidance ............ — — (1.7) — (1.7)
2009 Change .......... 27.8 8.7 1.1 1.8 39.4
Balance at 12/31/09 ...... $ (6.0) $(236.5) $(0.6) $ 0.5 $(242.6)
2010 Change .......... 15.2 2.6 1.2 0.1 19.1
Balance at 12/31/10 ...... $ 9.2 $(233.9) $ 0.6 $ 0.6 $(223.5)
2011 Change .......... (29.6) (49.5) 0.1 (1.2) (80.2)
Balance at 12/31/11 ...... $(20.4) $(283.4) $ 0.7 $(0.6) $(303.7)
The 2011 ending balance of $0.7 million in the table above for Net Unrealized Gain (Loss) on
Marketable Securities – OTTI represents the cumulative favorable mark to market adjustment on debt
securities for which OTTI was previously recognized under the amended FASB guidance.
123