Lexmark 2011 Annual Report Download - page 54
Download and view the complete annual report
Please find page 54 of the 2011 Lexmark annual report below. You can navigate through the pages in the report by either clicking on the pages listed below, or by using the keyword search tool below to find specific information within the annual report.-
 1
1 -
2
-
3
-
4
-
5
-
6
-
7
-
8
-
9
-
10
-
11
-
12
-
13
-
14
-
15
-
16
-
17
-
18
-
19
-
20
-
21
-
22
-
23
-
24
-
25
-
26
-
27
-
28
-
29
-
30
-
31
-
32
-
33
-
34
-
35
-
36
-
37
-
38
-
39
-
40
-
41
-
42
-
43
-
 44
44 -
 45
45 -
 46
46 -
 47
47 -
 48
48 -
 49
49 -
 50
50 -
 51
51 -
 52
52 -
 53
53 -
 54
54 -
 55
55 -
 56
56 -
 57
57 -
 58
58 -
 59
59 -
 60
60 -
 61
61 -
 62
62 -
 63
63 -
 64
64 -
65
-
66
-
67
-
68
-
69
-
70
-
71
-
72
-
73
-
74
-
75
-
76
-
77
-
78
-
79
-
80
-
81
-
82
-
83
-
84
-
85
-
86
-
87
-
88
-
89
-
90
-
91
-
92
-
93
-
94
-
95
-
96
-
97
-
98
-
99
-
100
-
101
-
102
-
103
-
104
-
105
-
106
-
107
-
108
-
109
-
110
-
111
-
112
-
113
-
114
-
115
-
116
-
117
-
118
-
119
-
120
-
121
-
122
-
123
-
124
-
125
-
126
-
127
-
128
-
129
-
130
-
131
-
132
-
133
-
134
-
135
-
136
-
137
-
138
-
139
-
140
-
141
-
142
-
143
-
144
-
145
-
146
-
147
-
148
-
149
-
150
-
151
-
152
-
153
-
154
-
155
-
156
-
157
-
158
-
159
-
160
-
161
-
162
-
163
-
164
 |
 |

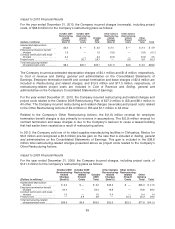
Operating Expense
The following table presents information regarding the Company’s operating expenses during the
periods indicated:
2011 2010 2009
(Dollars in Millions) Dollars % of Rev Dollars % of Rev Dollars % of Rev
Research and development ........ $ 374.5 9.0% $ 369.0 8.8% $ 375.3 9.7%
Selling, general & administrative .... 761.2 18.2% 701.2 16.7% 647.8 16.7%
Restructuring and related charges . . . 2.0 0.0% 2.4 0.0% 70.6 1.8%
Total operating expense ........... $1,137.7 27.3% $1,072.6 25.5% $1,093.7 28.2%
Research and development expenses increased in 2011 versus last year primarily reflecting higher
expenses due to Perceptive Software and the fact that 2011 contains the full year results of Perceptive
Software operating expenses, offset slightly by a decrease in ISS development spending. Research
and development decreased in 2010 compared to the prior year as the benefits of the restructuring
actions were partially offset by higher result-based compensation as well as the addition of Perceptive
Software in the second quarter of 2010.
Selling, general and administrative (“SG&A”) expenses in 2011 increased YTY due principally to the
acquisition of Perceptive Software, as well as increased expenses in ISS and All other, principally due
to currency. SG&A expenses in 2010 increased YTY due to the addition of Perceptive Software in the
second quarter of 2010 and higher result-based compensation, partially offset by the benefits of the
restructuring actions completed in 2009 and 2010. SG&A expenses for the periods presented in the
table above include expenses related to the Company’s restructuring activities along with acquisition-
related charges. See discussion below of restructuring-related charges and project costs and
acquisition-related adjustments included in the Company’s operating expenses for the years presented
in the table above.
In 2011, the Company incurred $24.7 million of pre-tax restructuring and related charges and project
costs in operating expense due to the Company’s restructuring plans. Of the $24.7 million incurred in
2011, $22.7 million is included in Selling, general and administrative while $2.0 million is included in
Restructuring and related charges (reversals) on the Company’s Consolidated Statements of Earnings.
Additionally, the Company incurred $9.0 million of pre-tax costs associated with acquisition related
adjustments. Of the $9.0 million incurred in 2011, $0.4 million is included in Research and
development, and $8.6 million is included in Selling, general, and administrative on the Company’s
Consolidated Statements of Earnings.
In 2010, the Company recognized $21.2 million of restructuring-related charges and project costs in
operating expense due to the Company’s restructuring plans. Of the $21.2 million incurred in 2010,
$18.8 million is included in Selling, general and administrative while $2.4 million is included in
Restructuring and related charges on the Company’s Consolidated Statements of Earnings.
Additionally, the Company incurred $10.0 million of pre-tax costs associated with the acquisition of
Perceptive Software included in Selling, general, and administrative on the Company’s Consolidated
Statements of Earnings.
In 2009, the Company incurred $89.8 million of restructuring-related charges and project costs due to
the Company’s restructuring plans. Of the $89.8 million of total restructuring-related charges and
project costs incurred in 2009, $19.2 million is included in Selling, general and administrative while
$70.6 million is included in Restructuring and related charges on the Company’s Consolidated
Statements of Earnings.
See “Restructuring and Related Charges and Project Costs” and “Acquisition-related Adjustments”
sections that follow for further discussion of the Company’s restructuring plans and acquisitions.
50