Lexmark 2011 Annual Report Download - page 55
Download and view the complete annual report
Please find page 55 of the 2011 Lexmark annual report below. You can navigate through the pages in the report by either clicking on the pages listed below, or by using the keyword search tool below to find specific information within the annual report.-
 1
1 -
2
-
3
-
4
-
5
-
6
-
7
-
8
-
9
-
10
-
11
-
12
-
13
-
14
-
15
-
16
-
17
-
18
-
19
-
20
-
21
-
22
-
23
-
24
-
25
-
26
-
27
-
28
-
29
-
30
-
31
-
32
-
33
-
34
-
35
-
36
-
37
-
38
-
39
-
40
-
41
-
42
-
43
-
44
-
 45
45 -
 46
46 -
 47
47 -
 48
48 -
 49
49 -
 50
50 -
 51
51 -
 52
52 -
 53
53 -
 54
54 -
 55
55 -
 56
56 -
 57
57 -
 58
58 -
 59
59 -
 60
60 -
 61
61 -
 62
62 -
 63
63 -
 64
64 -
 65
65 -
66
-
67
-
68
-
69
-
70
-
71
-
72
-
73
-
74
-
75
-
76
-
77
-
78
-
79
-
80
-
81
-
82
-
83
-
84
-
85
-
86
-
87
-
88
-
89
-
90
-
91
-
92
-
93
-
94
-
95
-
96
-
97
-
98
-
99
-
100
-
101
-
102
-
103
-
104
-
105
-
106
-
107
-
108
-
109
-
110
-
111
-
112
-
113
-
114
-
115
-
116
-
117
-
118
-
119
-
120
-
121
-
122
-
123
-
124
-
125
-
126
-
127
-
128
-
129
-
130
-
131
-
132
-
133
-
134
-
135
-
136
-
137
-
138
-
139
-
140
-
141
-
142
-
143
-
144
-
145
-
146
-
147
-
148
-
149
-
150
-
151
-
152
-
153
-
154
-
155
-
156
-
157
-
158
-
159
-
160
-
161
-
162
-
163
-
164
 |
 |

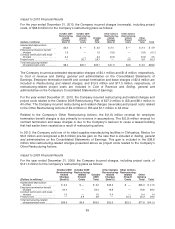
Operating Income (Loss)
The following table provides operating income by reportable segment:
(Dollars in Millions) 2011 2010 Change 2010 2009 Change
ISS ............................... $764.5 $ 744.6 3%$ 744.6 $ 487.3 53%
% of revenue ..................... 18.7% 17.9% 0.8 pts 17.9% 12.6%5.3 pts
Perceptive Software ................. (29.6) (16.1) -84% (16.1) — —
% of revenue ..................... -31.2% -43.2%12.0 pts -43.2% — —
All other ........................... (292.0) (281.6) -4% (281.6) (271.2) -4%
Total operating income (loss) .......... $442.9 $ 446.9 -1%$ 446.9 $ 216.1 107%
% of total revenue ................. 10.6% 10.6% 0 pts 10.6% 5.6% 5 pts
For the year ended December 31, 2011, the decrease in consolidated operating income was primarily
in the Perceptive Software segment, offset slightly by improvement in operating income (loss) for the
ISS segment due to laser hardware revenue growth and improved margins, as well as improved
hardware mix. The operating loss on the Perceptive Software segment was driven by an increase in
both development and marketing and sales expense ahead of revenue growth. For Perceptive
Software, operating income (loss) includes the full year results for 2011 as well as activities
subsequent to the acquisition for 2010. The Company acquired Perceptive Software on June 7, 2010.
For the year ended December 31, 2010, the increase in consolidated operating income was primarily
due to an increased gross profit, together with a reduction of operating expenses in ISS.
During 2011, the Company incurred total pre-tax restructuring-related charges and project costs of
$16.6 million in ISS and $13.3 million in All other, as well as pre-tax acquisition-related items of $26.1
million primarily in Perceptive Software and $3.3 million in All other. During 2010, the Company
incurred total pre-tax restructuring-related charges and project costs of $29.4 million in ISS and $9.2
million in All other as well as pre-tax acquisition-related items of $25.0 million primarily in Perceptive
Software and $7.1 million in All other. During 2009, the Company incurred total pre-tax restructuring-
related charges and project costs of $109 million in ISS and $32.3 million in All other.
See “Restructuring and Related Charges and Project Costs” and “Acquisition-related Adjustments”
sections that follow for further discussion.
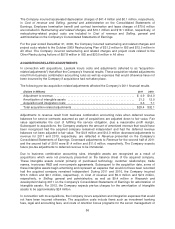
Interest and Other
The following table provides interest and other information:
(Dollars in Millions) 2011 2010 2009
Interest (income) expense, net ...................................... $29.9 $26.3 $21.4
Other (income) expense, net ........................................ (0.6) (1.2) 4.6
Net impairment losses on securities .................................. — 0.3 3.1
Total interest and other (income) expense, net ......................... $29.3 $25.4 $29.1
Total interest and other (income) expense, net, was expense of $29.3 million in 2011 compared to
expense of $25.4 million in 2010. The 2011 net expense increase YTY was primarily due to lower
interest income from declining interest rates on the Company’s investments.
Total interest and other (income) expense, net, was expense of $25.4 million in 2010 compared to
expense of $29.1 million in 2009. The 2010 net expense decrease YTY was primarily due to lower
impairment losses on securities, increased realized gains on the sale of marketable securities as well
51