Lexmark 2011 Annual Report Download - page 34
Download and view the complete annual report
Please find page 34 of the 2011 Lexmark annual report below. You can navigate through the pages in the report by either clicking on the pages listed below, or by using the keyword search tool below to find specific information within the annual report.-
 1
1 -
2
-
3
-
4
-
5
-
6
-
7
-
8
-
9
-
10
-
11
-
12
-
13
-
14
-
15
-
16
-
17
-
18
-
19
-
20
-
21
-
22
-
23
-
 24
24 -
 25
25 -
 26
26 -
 27
27 -
 28
28 -
 29
29 -
 30
30 -
 31
31 -
 32
32 -
 33
33 -
 34
34 -
 35
35 -
 36
36 -
 37
37 -
 38
38 -
 39
39 -
 40
40 -
 41
41 -
 42
42 -
 43
43 -
 44
44 -
45
-
46
-
47
-
48
-
49
-
50
-
51
-
52
-
53
-
54
-
55
-
56
-
57
-
58
-
59
-
60
-
61
-
62
-
63
-
64
-
65
-
66
-
67
-
68
-
69
-
70
-
71
-
72
-
73
-
74
-
75
-
76
-
77
-
78
-
79
-
80
-
81
-
82
-
83
-
84
-
85
-
86
-
87
-
88
-
89
-
90
-
91
-
92
-
93
-
94
-
95
-
96
-
97
-
98
-
99
-
100
-
101
-
102
-
103
-
104
-
105
-
106
-
107
-
108
-
109
-
110
-
111
-
112
-
113
-
114
-
115
-
116
-
117
-
118
-
119
-
120
-
121
-
122
-
123
-
124
-
125
-
126
-
127
-
128
-
129
-
130
-
131
-
132
-
133
-
134
-
135
-
136
-
137
-
138
-
139
-
140
-
141
-
142
-
143
-
144
-
145
-
146
-
147
-
148
-
149
-
150
-
151
-
152
-
153
-
154
-
155
-
156
-
157
-
158
-
159
-
160
-
161
-
162
-
163
-
164
 |
 |

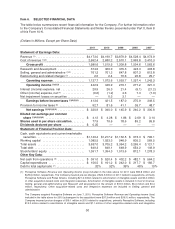
Item 6. SELECTED FINANCIAL DATA
The table below summarizes recent financial information for the Company. For further information refer
to the Company’s Consolidated Financial Statements and Notes thereto presented under Part II, Item 8
of this Form 10-K.
(Dollars in Millions, Except per Share Data)
2011 2010 2009 2008 2007
Statement of Earnings Data:
Revenue (1) ............................... $4,173.0 $4,199.7 $3,879.9 $4,528.4 $4,973.9
Cost of revenue (1)(2) ........................ 2,592.4 2,680.2 2,570.1 2,993.8 3,410.3
Gross profit .......................... 1,580.6 1,519.5 1,309.8 1,534.6 1,563.6
Research and development ................. 374.5 369.0 375.3 423.3 403.8
Selling, general and administrative (1)(2) ........ 761.2 701.2 647.8 807.3 812.8
Restructuring and related charges (2) .......... 2.0 2.4 70.6 26.8 25.7
Operating expense .................... 1,137.7 1,072.6 1,093.7 1,257.4 1,242.3
Operating income (1)(2)(3) ................ 442.9 446.9 216.1 277.2 321.3
Interest (income) expense, net ............... 29.9 26.3 21.4 (6.1) (21.2)
Other (income) expense, net (4) .............. (0.6) (1.2) 4.6 7.4 (7.0)
Net impairment losses on securities ........... — 0.3 3.1 — —
Earnings before income taxes (1)(2)(3)(4) . . . 413.6 421.5 187.0 275.9 349.5
Provision for income taxes (5) ................ 92.7 81.5 41.1 35.7 48.7
Net earnings (1)(2)(3)(4)(5) ................. $ 320.9 $ 340.0 $ 145.9 $ 240.2 $ 300.8
Diluted net earnings per common
share (1)(2)(3)(4)(5) ......................... $ 4.12 $ 4.28 $ 1.86 $ 2.69 $ 3.14
Shares used in per share calculation ........ 77.9 79.5 78.6 89.2 95.8
Dividends declared per share .............. $ 0.25 ————
Statement of Financial Position Data:
Cash, cash equivalents and current marketable
securities ............................... $1,149.4 $1,217.2 $1,132.5 $ 973.3 $ 796.1
Working capital ........................... 1,085.5 1,023.3 948.9 805.2 569.5
Total assets .............................. 3,637.0 3,705.2 3,354.2 3,265.4 3,121.1
Total debt ................................ 649.3 649.1 648.9 654.2 149.9
Stockholders’ equity ....................... 1,391.7 1,394.3 1,013.6 812.1 1,278.3
Other Key Data:
Net cash from operations (6) ................. $ 391.0 $ 520.4 $ 402.2 $ 482.1 $ 564.2
Capital expenditures ....................... $ 156.5 $ 161.2 $ 242.0 $ 217.7 $ 182.7
Debt to total capital ratio (7) .................. 32% 32% 39% 45% 10%
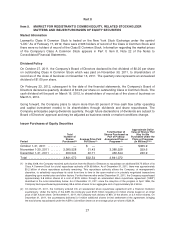
(1) Perceptive Software Revenue and Operating income (loss) included in the table above for 2011 were $94.8 million and
$(29.6) million, respectively. The Company incurred pre-tax charges of $24.5 million in 2011 related to acquisitions, primarily
Perceptive Software and Pallas Athena, including $21.2 million related to amortization of intangible assets and $3.3 million
of other acquisition-related costs and integration expenses. Amortization of intangible assets is included in Cost of revenue,
Selling, general and administrative and Research and development in the amount of $15.5 million, $5.3 million and $0.4
million, respectively. Other acquisition-related costs and integration expenses are included in Selling, general and
administrative.
The Company acquired Perceptive Software on June 7, 2010. Perceptive Software Revenue and Operating income (loss)
included in the table above for 2010 (subsequent to the acquisition) were $37.3 million and $(16.1) million, respectively. The
Company incurred pre-tax charges of $19.1 million in 2010 related to acquisitions, primarily Perceptive Software, including
$12.0 million related to amortization of intangible assets and $7.1 million of other acquisition-related costs and integration
30