Lexmark 2011 Annual Report Download - page 63
Download and view the complete annual report
Please find page 63 of the 2011 Lexmark annual report below. You can navigate through the pages in the report by either clicking on the pages listed below, or by using the keyword search tool below to find specific information within the annual report.-
 1
1 -
2
-
3
-
4
-
5
-
6
-
7
-
8
-
9
-
10
-
11
-
12
-
13
-
14
-
15
-
16
-
17
-
18
-
19
-
20
-
21
-
22
-
23
-
24
-
25
-
26
-
27
-
28
-
29
-
30
-
31
-
32
-
33
-
34
-
35
-
36
-
37
-
38
-
39
-
40
-
41
-
42
-
43
-
44
-
45
-
46
-
47
-
48
-
49
-
50
-
51
-
52
-
 53
53 -
 54
54 -
 55
55 -
 56
56 -
 57
57 -
 58
58 -
 59
59 -
 60
60 -
 61
61 -
 62
62 -
 63
63 -
 64
64 -
 65
65 -
 66
66 -
 67
67 -
 68
68 -
 69
69 -
 70
70 -
 71
71 -
 72
72 -
 73
73 -
74
-
75
-
76
-
77
-
78
-
79
-
80
-
81
-
82
-
83
-
84
-
85
-
86
-
87
-
88
-
89
-
90
-
91
-
92
-
93
-
94
-
95
-
96
-
97
-
98
-
99
-
100
-
101
-
102
-
103
-
104
-
105
-
106
-
107
-
108
-
109
-
110
-
111
-
112
-
113
-
114
-
115
-
116
-
117
-
118
-
119
-
120
-
121
-
122
-
123
-
124
-
125
-
126
-
127
-
128
-
129
-
130
-
131
-
132
-
133
-
134
-
135
-
136
-
137
-
138
-
139
-
140
-
141
-
142
-
143
-
144
-
145
-
146
-
147
-
148
-
149
-
150
-
151
-
152
-
153
-
154
-
155
-
156
-
157
-
158
-
159
-
160
-
161
-
162
-
163
-
164
 |
 |
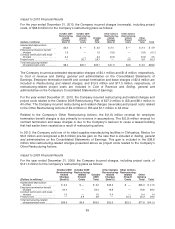
The $129.4 million decrease in cash-flow from operating activities from 2010 to 2011 was driven by the
following factors.
The decrease in Accrued liabilities and unfavorable change in Other assets and liabilities, collectively,
was $191.6 million more in 2011 than in 2010. The largest factors behind the YTY movement included
annual incentive compensation payments, cash paid for income taxes, pension funding and increase in
capital lease receivable.
Annual incentive compensation payments were approximately $65 million in 2011 compared to $29
million in 2010, driven by the improvement in 2010 full year results compared to that of 2009. Cash
paid for income taxes was $93 million in 2011, compared to $77 million in 2010. The Company also
made approximately $31 million of pension and post retirement plan payments in 2011 compared to
the net contribution of $9 million in 2010. The increase of capital lease receivable YTY generated an
additional unfavorable impact of $32 million and is due to the growth in managed print services
arrangements in 2011.
Accounts payable decreased $50.6 million in 2011 while they increased $22.7 million in 2010. The
decrease in 2011 is driven by the shorter payment cycle along with decreased spending levels.
The activities above were partially offset by the following factors.
Trade receivables balances decreased $24 million in 2011 while they increased $28.5 million in 2010,
excluding receivables recognized on the date of acquisitions. This $52.5 million fluctuation between the
activity in 2011 and that of 2010 is driven by the timing of revenue in the fourth quarter as well as less
delinquencies.
Inventories decreased $30.6 million in 2011 while they increased $8.8 million in 2010. This $39.4
million fluctuation results from decreased spending in 2011 relative to 2010.
Refer to the contractual cash obligations table that follows for additional information regarding items
that will likely impact the Company’s future cash flows.
The $118.2 million increase in cash flow from operating activities from 2009 to 2010 was driven by the
following factors.
Net earnings increased $194.1 million for 2010 as compared to 2009. The non-cash adjustment for
depreciation and amortization decreased $15.8 million YTY driven by the decrease in accelerated
depreciation in 2010 related to the Company’s restructuring actions.
Accounts payable increased $22.7 million in 2010 and decreased $47.8 million in 2009. The $70.5
million fluctuation between the activity in 2010 and that of 2009 is primarily driven by greater demand in
2010 coupled with a longer payment cycle. Furthermore, the year-end Accounts payable balance was
considerably higher at December 31, 2008 compared to December 31, 2009 and is a significant factor
in the Company’s 2009 and 2010 cash flows, respectively.
The activities above were partially offset by the following factors.
Inventories balances increased $8.8 million in 2010 and decreased $81.2 million in 2009. The $90.0
million fluctuation between the activity in 2010 and that of 2009 is primarily due to actions taken by the
Company in 2009 in response to challenging economic conditions that negatively impacted the
Company at that time.
Trade receivables balances increased $28.5 million in 2010 (excluding receivables recognized on the
date of acquisition of Perceptive Software) and decreased $2.3 million in 2009. The $30.8 million
59