Lexmark 2011 Annual Report Download - page 109
Download and view the complete annual report
Please find page 109 of the 2011 Lexmark annual report below. You can navigate through the pages in the report by either clicking on the pages listed below, or by using the keyword search tool below to find specific information within the annual report.-
 1
1 -
2
-
3
-
4
-
5
-
6
-
7
-
8
-
9
-
10
-
11
-
12
-
13
-
14
-
15
-
16
-
17
-
18
-
19
-
20
-
21
-
22
-
23
-
24
-
25
-
26
-
27
-
28
-
29
-
30
-
31
-
32
-
33
-
34
-
35
-
36
-
37
-
38
-
39
-
40
-
41
-
42
-
43
-
44
-
45
-
46
-
47
-
48
-
49
-
50
-
51
-
52
-
53
-
54
-
55
-
56
-
57
-
58
-
59
-
60
-
61
-
62
-
63
-
64
-
65
-
66
-
67
-
68
-
69
-
70
-
71
-
72
-
73
-
74
-
75
-
76
-
77
-
78
-
79
-
80
-
81
-
82
-
83
-
84
-
85
-
86
-
87
-
88
-
89
-
90
-
91
-
92
-
93
-
94
-
95
-
96
-
97
-
98
-
 99
99 -
 100
100 -
 101
101 -
 102
102 -
 103
103 -
 104
104 -
 105
105 -
 106
106 -
 107
107 -
 108
108 -
 109
109 -
 110
110 -
 111
111 -
 112
112 -
 113
113 -
 114
114 -
 115
115 -
 116
116 -
 117
117 -
 118
118 -
 119
119 -
120
-
121
-
122
-
123
-
124
-
125
-
126
-
127
-
128
-
129
-
130
-
131
-
132
-
133
-
134
-
135
-
136
-
137
-
138
-
139
-
140
-
141
-
142
-
143
-
144
-
145
-
146
-
147
-
148
-
149
-
150
-
151
-
152
-
153
-
154
-
155
-
156
-
157
-
158
-
159
-
160
-
161
-
162
-
163
-
164
 |
 |

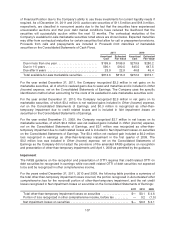
the vesting of the second and third tranches of the executive officer’s 2010 earned performance-based
restricted stock unit award to April 29, 2011. The total incremental compensation cost resulting from
the modification was $4.8 million, which was also the fair value of the award on the date of
modification, since the executive officer would not have vested under the original service condition and
no expense would have been recognized on a cumulative basis related to these tranches. The
Company would have incurred total expense of $4.3 million over the requisite service period related to
these tranches if the executive officer had vested under the terms of the original award.
During 2010, a certain number of executive officers of the Company were also granted additional RSU
awards having performance conditions, which could range from 124,925 RSUs to 374,775 RSUs
depending on the level of achievement. The expense for these awards was accrued at the maximum
level. The performance measure selected to indicate the level of achievement was free operating cash
flow, defined as net cash flow provided by operating activities less net cash outflows for property plant
and equipment and acquisitions. The performance period ended on December 31, 2010 and, as of that
date, the maximum level of the performance condition had been satisfied though the awards were
pending certification of the performance measure and approval by the Compensation and Pension
Committee. The table below includes the awards at the target level of 249,850 RSUs. If the maximum
level of the performance award had been included, the Weighted Average Grant Date Fair Value per
share would have been $34.07 for RSUs and DSUs granted during 2010 and $31.60 for RSUs and
DSUs outstanding at December 31, 2010. If the maximum level of performance awards had been
included, the Aggregate Intrinsic Value in millions would have been $76.8 for RSUs and DSUs
outstanding at December 31, 2010. A smaller number of other performance awards were also granted
in 2010. The expense for these awards was recognized in 2010 based on the Company’s best
estimate of achievement levels. The table below includes the adjustment from target to maximum of
124,925 RSUs as part of the activity reflected during 2011 in the granted line item.
During 2009, a certain number of executive officers of the Company were also granted additional RSU
awards having a performance condition, which could range from 78,339 RSUs to 235,014 RSUs
depending on the level of achievement. The performance measure selected to indicate the level of
achievement was return on net assets minus cash and marketable securities. The performance period
ended on December 31, 2009 and the awards were cancelled since the minimum level of the
performance condition was not satisfied. The table below includes the cancellation of the awards at the
target level of 156,678 RSUs as part of the activity reflected during 2010 in the forfeited or canceled
line item.
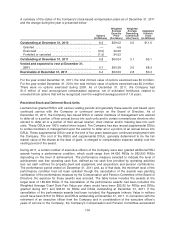
A summary of the status of the Company’s RSU and DSU grants as of December 31, 2011, 2010, and
2009, and changes during the years then ended is presented below:
Units
(In Millions)
Weighted
Average
Grant
Date Fair
Value
(Per Share)
Weighted
Average
Remaining
Contractual
Life (Years)
Aggregate
Intrinsic
Value
(In Millions)
RSUs and DSUs at December 31, 2008 .............. 1.5 $45.84 2.3 $39.7
Granted ....................................... 0.8 18.94
Vested ........................................ (0.4) 54.12
Forfeited or canceled ............................. (0.2) 41.53
RSUs and DSUs at December 31, 2009 .............. 1.7 $32.41 2.2 $44.5
Granted ....................................... 1.0 34.20
Vested ........................................ (0.4) 45.58
Forfeited or canceled ............................. (0.2) 21.27
RSUs and DSUs at December 31, 2010 .............. 2.1 $31.51 2.1 $72.5
Granted ....................................... 1.0 36.22
Vested ........................................ (0.7) 30.25
Forfeited or canceled ............................. (0.1) 33.13
RSUs and DSUs at December 31, 2011 .............. 2.3 $33.94 1.9 $76.9
105