Lexmark 2011 Annual Report Download - page 116
Download and view the complete annual report
Please find page 116 of the 2011 Lexmark annual report below. You can navigate through the pages in the report by either clicking on the pages listed below, or by using the keyword search tool below to find specific information within the annual report.-
 1
1 -
2
-
3
-
4
-
5
-
6
-
7
-
8
-
9
-
10
-
11
-
12
-
13
-
14
-
15
-
16
-
17
-
18
-
19
-
20
-
21
-
22
-
23
-
24
-
25
-
26
-
27
-
28
-
29
-
30
-
31
-
32
-
33
-
34
-
35
-
36
-
37
-
38
-
39
-
40
-
41
-
42
-
43
-
44
-
45
-
46
-
47
-
48
-
49
-
50
-
51
-
52
-
53
-
54
-
55
-
56
-
57
-
58
-
59
-
60
-
61
-
62
-
63
-
64
-
65
-
66
-
67
-
68
-
69
-
70
-
71
-
72
-
73
-
74
-
75
-
76
-
77
-
78
-
79
-
80
-
81
-
82
-
83
-
84
-
85
-
86
-
87
-
88
-
89
-
90
-
91
-
92
-
93
-
94
-
95
-
96
-
97
-
98
-
99
-
100
-
101
-
102
-
103
-
104
-
105
-
 106
106 -
 107
107 -
 108
108 -
 109
109 -
 110
110 -
 111
111 -
 112
112 -
 113
113 -
 114
114 -
 115
115 -
 116
116 -
 117
117 -
 118
118 -
 119
119 -
 120
120 -
 121
121 -
 122
122 -
 123
123 -
 124
124 -
 125
125 -
 126
126 -
127
-
128
-
129
-
130
-
131
-
132
-
133
-
134
-
135
-
136
-
137
-
138
-
139
-
140
-
141
-
142
-
143
-
144
-
145
-
146
-
147
-
148
-
149
-
150
-
151
-
152
-
153
-
154
-
155
-
156
-
157
-
158
-
159
-
160
-
161
-
162
-
163
-
164
 |
 |

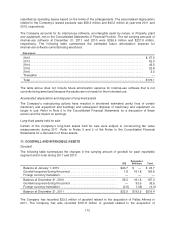
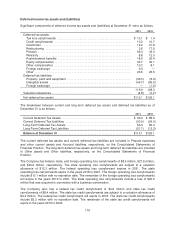
classified as operating leases based on the terms of the arrangements. The accumulated depreciation
related to the Company’s leased products was $58.3 million and $43.2 million at year-end 2011 and
2010, respectively.
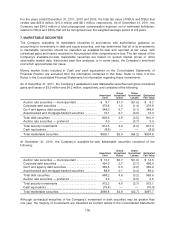
The Company accounts for its internal-use software, an intangible asset by nature, in Property, plant
and equipment, net on the Consolidated Statements of Financial Position. The net carrying amounts of
internal-use software at December 31, 2011 and 2010 were $236.9 million and $227.9 million,
respectively. The following table summarizes the estimated future amortization expense for
internal-use software currently being amortized.
Fiscal year:
2012 ........................................................................ $ 57.5
2013 ........................................................................ 52.0
2014 ........................................................................ 43.5
2015 ........................................................................ 22.8
2016 ........................................................................ 3.3
Thereafter ................................................................... —
Total ........................................................................ $179.1
The table above does not include future amortization expense for internal-use software that is not
currently being amortized because the assets are not ready for their intended use.
Accelerated depreciation and disposal of long-lived assets
The Company’s restructuring actions have resulted in shortened estimated useful lives of certain
machinery and equipment and buildings and subsequent disposal of machinery and equipment no
longer in use. Refer to Note 5 to the Consolidated Financial Statements for a discussion of these
actions and the impact on earnings.
Long-lived assets held for sale
Certain of the Company’s long-lived assets held for sale were subject to nonrecurring fair value
measurements during 2011. Refer to Notes 3 and 5 of the Notes to the Consolidated Financial
Statements for a discussion of these assets.
11. GOODWILL AND INTANGIBLE ASSETS
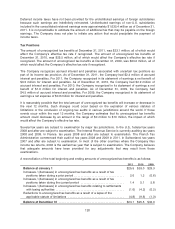
Goodwill
The following table summarizes the changes in the carrying amount of goodwill for each reportable
segment and in total during 2011 and 2010.
ISS
Perceptive
Software Total
Balance at January 1, 2010 ..................................... $23.7 $ — $ 23.7
Goodwill acquired during the period .............................. 1.8 161.8 163.6
Foreign currency translation ..................................... — — —
Balance at December 31, 2010 .................................. 25.5 161.8 187.3
Goodwill acquired during the period .............................. — 33.5 33.5
Foreign currency translation ..................................... (2.6) (1.8) (4.4)
Balance at December 31, 2011 .................................. $22.9 $193.5 $216.4
The Company has recorded $33.5 million of goodwill related to the acquisition of Pallas Athena in
2011. The Company has also recorded $161.8 million of goodwill related to the acquisition of
112