Lexmark 2011 Annual Report Download - page 50
Download and view the complete annual report
Please find page 50 of the 2011 Lexmark annual report below. You can navigate through the pages in the report by either clicking on the pages listed below, or by using the keyword search tool below to find specific information within the annual report.-
 1
1 -
2
-
3
-
4
-
5
-
6
-
7
-
8
-
9
-
10
-
11
-
12
-
13
-
14
-
15
-
16
-
17
-
18
-
19
-
20
-
21
-
22
-
23
-
24
-
25
-
26
-
27
-
28
-
29
-
30
-
31
-
32
-
33
-
34
-
35
-
36
-
37
-
38
-
39
-
 40
40 -
 41
41 -
 42
42 -
 43
43 -
 44
44 -
 45
45 -
 46
46 -
 47
47 -
 48
48 -
 49
49 -
 50
50 -
 51
51 -
 52
52 -
 53
53 -
 54
54 -
 55
55 -
 56
56 -
 57
57 -
 58
58 -
 59
59 -
 60
60 -
61
-
62
-
63
-
64
-
65
-
66
-
67
-
68
-
69
-
70
-
71
-
72
-
73
-
74
-
75
-
76
-
77
-
78
-
79
-
80
-
81
-
82
-
83
-
84
-
85
-
86
-
87
-
88
-
89
-
90
-
91
-
92
-
93
-
94
-
95
-
96
-
97
-
98
-
99
-
100
-
101
-
102
-
103
-
104
-
105
-
106
-
107
-
108
-
109
-
110
-
111
-
112
-
113
-
114
-
115
-
116
-
117
-
118
-
119
-
120
-
121
-
122
-
123
-
124
-
125
-
126
-
127
-
128
-
129
-
130
-
131
-
132
-
133
-
134
-
135
-
136
-
137
-
138
-
139
-
140
-
141
-
142
-
143
-
144
-
145
-
146
-
147
-
148
-
149
-
150
-
151
-
152
-
153
-
154
-
155
-
156
-
157
-
158
-
159
-
160
-
161
-
162
-
163
-
164
 |
 |

Business Factors
Lexmark’s 2011 results reflected revenue that decreased less than 1% compared to 2010. Supplies
revenue was flat year-to year (“YTY”), hardware revenue decreased 7% YTY, while software and other
revenue increased 22% due to Perceptive Software. Operating income decreased less than 1% YTY,
primarily due to the improvement in ISS operating income in 2011 versus 2010 driven by laser
hardware revenue growth and improved margins. The improvement in ISS operating income was offset
by increases in both development and marketing and sales expense principally due to the acquisition
of and increased investment in Perceptive Software.
Operating Results Summary
The following discussion and analysis should be read in conjunction with the Consolidated Financial
Statements and Notes thereto. The following table summarizes the results of the Company’s
operations for the years ended December 31, 2011, 2010 and 2009:
2011 2010 2009
(Dollars in Millions) Dollars % of Rev Dollars % of Rev Dollars % of Rev
Revenue ........................ $4,173.0 100.0% $4,199.7 100.0% $3,879.9 100.0%
Gross profit ..................... 1,580.6 37.9 1,519.5 36.2 1,309.8 33.8
Operating expense ............... 1,137.7 27.3 1,072.6 25.5 1,093.7 28.2
Operating income ................ 442.9 10.6 446.9 10.6 216.1 5.6
Net earnings ..................... 320.9 7.7 340.0 8.1 145.9 3.8
During 2011, total revenue was $4.2 billion, down less than 1% compared to 2010. Supplies revenue
was flat YTY, hardware revenue decreased 7% YTY, and software and other grew 22% YTY.
During 2010, total revenue was $4.2 billion or up 8% from 2009. Supplies revenue increased 6% YTY
while hardware revenue increased 13% YTY.
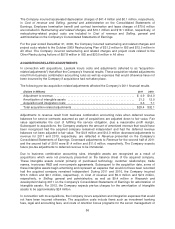
Net earnings for the year ended December 31, 2011 decreased 6% from the prior year primarily due to
an increase in income taxes combined with a 1% decrease in operating income. The Company
recorded discrete tax items in 2011 that resulted in a higher tax provision and thus a higher effective
tax rate compared to prior year. Net earnings in 2011 included $29.9 million of pre-tax restructuring-
related charges and project costs along with $29.4 million of pre-tax acquisition-related adjustments.
The Company uses the term “project costs” for incremental charges related to the execution of its
restructuring plans. The Company uses the term “acquisition-related adjustments” for purchase
accounting adjustments and incremental acquisition and integration costs related to acquisitions.
Net earnings for the year ended December 31, 2010 increased 133% from the prior year primarily due
to higher operating income as well as lower restructuring-related charges, somewhat offset by
acquisition-related charges. Net earnings in 2010 included $38.6 million of pre-tax restructuring-related
charges and project costs along with $32.1 million of pre-tax acquisition-related adjustments.
See “Restructuring and Related Charges and Project Costs” and “Acquisition-related Adjustments”
sections that follow for further discussion.
46