Lexmark 2011 Annual Report Download - page 132
Download and view the complete annual report
Please find page 132 of the 2011 Lexmark annual report below. You can navigate through the pages in the report by either clicking on the pages listed below, or by using the keyword search tool below to find specific information within the annual report.-
 1
1 -
2
-
3
-
4
-
5
-
6
-
7
-
8
-
9
-
10
-
11
-
12
-
13
-
14
-
15
-
16
-
17
-
18
-
19
-
20
-
21
-
22
-
23
-
24
-
25
-
26
-
27
-
28
-
29
-
30
-
31
-
32
-
33
-
34
-
35
-
36
-
37
-
38
-
39
-
40
-
41
-
42
-
43
-
44
-
45
-
46
-
47
-
48
-
49
-
50
-
51
-
52
-
53
-
54
-
55
-
56
-
57
-
58
-
59
-
60
-
61
-
62
-
63
-
64
-
65
-
66
-
67
-
68
-
69
-
70
-
71
-
72
-
73
-
74
-
75
-
76
-
77
-
78
-
79
-
80
-
81
-
82
-
83
-
84
-
85
-
86
-
87
-
88
-
89
-
90
-
91
-
92
-
93
-
94
-
95
-
96
-
97
-
98
-
99
-
100
-
101
-
102
-
103
-
104
-
105
-
106
-
107
-
108
-
109
-
110
-
111
-
112
-
113
-
114
-
115
-
116
-
117
-
118
-
119
-
120
-
121
-
 122
122 -
 123
123 -
 124
124 -
 125
125 -
 126
126 -
 127
127 -
 128
128 -
 129
129 -
 130
130 -
 131
131 -
 132
132 -
 133
133 -
 134
134 -
 135
135 -
 136
136 -
 137
137 -
 138
138 -
 139
139 -
 140
140 -
 141
141 -
 142
142 -
143
-
144
-
145
-
146
-
147
-
148
-
149
-
150
-
151
-
152
-
153
-
154
-
155
-
156
-
157
-
158
-
159
-
160
-
161
-
162
-
163
-
164
 |
 |

Pension
Benefits
Other
Postretirement
Benefits
2011 2010 2009 2011 2010 2009
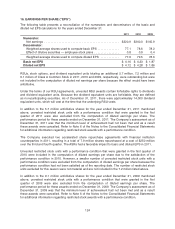
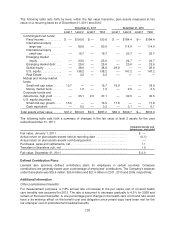
Weighted-Average Assumptions Used to Determine Net
Periodic Benefit Cost for Years Ended December 31:
Discount Rate ..................................... 5.2% 5.6% 6.2% 4.7% 5.4% 6.4%
Expected long-term return on plan assets .............. 7.2% 7.5% 7.4% — — —
Rate of compensation increase ...................... 2.6% 2.7% 2.8% 4.0% 4.0% 4.0%
Plan assets:
Plan assets are invested in equity securities, government and agency securities, mortgage-backed
securities, commercial mortgage-backed securities, asset-backed securities, corporate debt, annuity
contracts and other securities. The U.S. defined benefit plan comprises a significant portion of the
assets and liabilities relating to the defined benefit plans. The investment goal of the U.S. defined
benefit plan is to achieve an adequate net investment return in order to provide for future benefit
payments to its participants. Asset allocation percentages are targeted to be 65% equity and 35% fixed
income investments. The U.S. pension plan employs professional investment managers to invest in
U.S. equity, global equity, international developed equity, emerging market equity, U.S. fixed income,
high yield bonds and emerging market debt. Each investment manager operates under an investment
management contract that includes specific investment guidelines, requiring among other actions,
adequate diversification, prudent use of derivatives and standard risk management practices such as
portfolio constraints relating to established benchmarks. The plan currently uses a combination of both
active management and passive index funds to achieve its investment goals.
The Company uses third parties to report the fair values of its plan assets. The Company tested the fair
value of the portfolio and default level assumptions provided by the third parties as of December 31,
2011 using the following procedures:
• assessment of trading activity and other market data,
• assessment of variability in pricing by comparison to independent source(s) of pricing, and
• back-testing of transactions to determine historical accuracy of net asset value per share/unit
as an exit price.
The following is a description of the valuation methodologies used for pension assets measured at fair
value. Refer to Note 3 of the Notes to Consolidated Financial Statements for details on the accounting
framework for measuring fair value and the related fair value hierarchy.
Commingled trust funds: Valued at the closing price reported on the active market on which the
funds are traded or at the net asset value per unit at year end as quoted by the funds as the basis
for current transactions.
Mutual and money market funds: Valued at the per share (unit) published as the basis for current
transactions.
Corporate bonds and debentures: Valued at quoted prices in markets that are not active, broker
dealer quotations, or other methods by which all significant inputs are observable, either directly or
indirectly.
U.S. equity securities: Valued at the closing price reported on the active market on which the
securities are traded or at quoted prices in markets that are not active, broker dealer quotations, or
other methods by which all significant inputs are observable, either directly or indirectly.
128