Lexmark 2011 Annual Report Download - page 142
Download and view the complete annual report
Please find page 142 of the 2011 Lexmark annual report below. You can navigate through the pages in the report by either clicking on the pages listed below, or by using the keyword search tool below to find specific information within the annual report.-
 1
1 -
2
-
3
-
4
-
5
-
6
-
7
-
8
-
9
-
10
-
11
-
12
-
13
-
14
-
15
-
16
-
17
-
18
-
19
-
20
-
21
-
22
-
23
-
24
-
25
-
26
-
27
-
28
-
29
-
30
-
31
-
32
-
33
-
34
-
35
-
36
-
37
-
38
-
39
-
40
-
41
-
42
-
43
-
44
-
45
-
46
-
47
-
48
-
49
-
50
-
51
-
52
-
53
-
54
-
55
-
56
-
57
-
58
-
59
-
60
-
61
-
62
-
63
-
64
-
65
-
66
-
67
-
68
-
69
-
70
-
71
-
72
-
73
-
74
-
75
-
76
-
77
-
78
-
79
-
80
-
81
-
82
-
83
-
84
-
85
-
86
-
87
-
88
-
89
-
90
-
91
-
92
-
93
-
94
-
95
-
96
-
97
-
98
-
99
-
100
-
101
-
102
-
103
-
104
-
105
-
106
-
107
-
108
-
109
-
110
-
111
-
112
-
113
-
114
-
115
-
116
-
117
-
118
-
119
-
120
-
121
-
122
-
123
-
124
-
125
-
126
-
127
-
128
-
129
-
130
-
131
-
 132
132 -
 133
133 -
 134
134 -
 135
135 -
 136
136 -
 137
137 -
 138
138 -
 139
139 -
 140
140 -
 141
141 -
 142
142 -
 143
143 -
 144
144 -
 145
145 -
 146
146 -
 147
147 -
 148
148 -
 149
149 -
 150
150 -
 151
151 -
 152
152 -
153
-
154
-
155
-
156
-
157
-
158
-
159
-
160
-
161
-
162
-
163
-
164
 |
 |

Software segment was further influenced by an increase in development, marketing and sales expense
ahead of revenue growth.
Operating income (loss) noted above for the year ended December 31, 2010 includes restructuring and
related charges of $7.5 million in ISS and $0.8 million in All other. Operating income (loss) related to
Perceptive Software for the year ended December 31, 2010 includes $11.6 million of amortization
expense related to intangible assets acquired by the Company in the second quarter of 2010.
Operating income (loss) noted above for the year ended December 31, 2009 includes restructuring and
related charges of $93.6 million in ISS and $18.5 million in All other.
During 2011, 2010 and 2009, one customer, Dell, accounted for $414.7 million or approximately 10%,
$461.3 million or approximately 11% and $495.9 million or approximately 13% of the Company’s total
revenue, respectively. Sales to Dell are included in ISS.
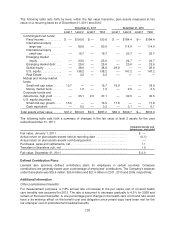
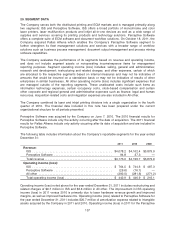
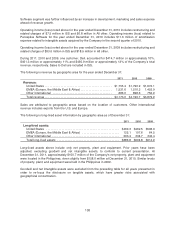
The following is revenue by geographic area for the year ended December 31:
2011 2010 2009
Revenue:
United States ........................................... $1,755.4 $1,790.9 $1,672.1
EMEA (Europe, the Middle East & Africa) .................... 1,531.6 1,510.2 1,453.9
Other International ...................................... 886.0 898.6 753.9
Total revenue ........................................... $4,173.0 $4,199.7 $3,879.9
Sales are attributed to geographic areas based on the location of customers. Other International
revenue includes exports from the U.S. and Europe.
The following is long-lived asset information by geographic area as of December 31:
2011 2010 2009
Long-lived assets:
United States ............................................... $460.3 $462.5 $508.0
EMEA (Europe, the Middle East & Africa) ........................ 125.1 107.6 64.5
Other International ........................................... 303.4 334.7 342.4
Total long-lived assets ........................................ $888.8 $904.8 $914.9
Long-lived assets above include only net property, plant and equipment. Prior years have been
adjusted, excluding goodwill and net intangible assets, to conform to current presentation. At
December 31, 2011, approximately $150.7 million of the Company’s net property, plant and equipment
were located in the Philippines, down slightly from $158.0 million at December 31, 2010. Similar levels
of property, plant, and equipment were held in the Philippines in 2009.
Goodwill and net intangible assets were excluded from the preceding table for all years presented in
order to re-focus the disclosure on tangible assets, which have greater risks associated with
geographical concentration.
138