Lexmark 2011 Annual Report Download - page 56
Download and view the complete annual report
Please find page 56 of the 2011 Lexmark annual report below. You can navigate through the pages in the report by either clicking on the pages listed below, or by using the keyword search tool below to find specific information within the annual report.-
 1
1 -
2
-
3
-
4
-
5
-
6
-
7
-
8
-
9
-
10
-
11
-
12
-
13
-
14
-
15
-
16
-
17
-
18
-
19
-
20
-
21
-
22
-
23
-
24
-
25
-
26
-
27
-
28
-
29
-
30
-
31
-
32
-
33
-
34
-
35
-
36
-
37
-
38
-
39
-
40
-
41
-
42
-
43
-
44
-
45
-
 46
46 -
 47
47 -
 48
48 -
 49
49 -
 50
50 -
 51
51 -
 52
52 -
 53
53 -
 54
54 -
 55
55 -
 56
56 -
 57
57 -
 58
58 -
 59
59 -
 60
60 -
 61
61 -
 62
62 -
 63
63 -
 64
64 -
 65
65 -
 66
66 -
67
-
68
-
69
-
70
-
71
-
72
-
73
-
74
-
75
-
76
-
77
-
78
-
79
-
80
-
81
-
82
-
83
-
84
-
85
-
86
-
87
-
88
-
89
-
90
-
91
-
92
-
93
-
94
-
95
-
96
-
97
-
98
-
99
-
100
-
101
-
102
-
103
-
104
-
105
-
106
-
107
-
108
-
109
-
110
-
111
-
112
-
113
-
114
-
115
-
116
-
117
-
118
-
119
-
120
-
121
-
122
-
123
-
124
-
125
-
126
-
127
-
128
-
129
-
130
-
131
-
132
-
133
-
134
-
135
-
136
-
137
-
138
-
139
-
140
-
141
-
142
-
143
-
144
-
145
-
146
-
147
-
148
-
149
-
150
-
151
-
152
-
153
-
154
-
155
-
156
-
157
-
158
-
159
-
160
-
161
-
162
-
163
-
164
 |
 |

as the non-recurrence of the write-down of a private equity investment. These factors were offset
partially by the continued lower interest income from declining interest rates on the Company’s
investments.
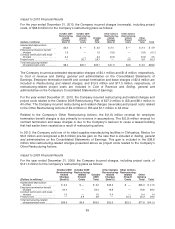
Provision for Income Taxes and Related Matters
The Company’s effective income tax rate was approximately 22.4%, 19.3% and 22.0% in 2011, 2010
and 2009, respectively. See Note 14 of the Notes to the Consolidated Financial Statements in Part II,
Item 8 for a reconciliation of the Company’s effective tax rate to the U.S. statutory rate.
The 3.1 percentage point increase of the effective tax rate from 2010 to 2011 was due to the
adjustments to previously accrued taxes in 2011 compared to 2010 (increase of 2.3 percentage
points), a geographic shift in earnings toward higher tax jurisdictions in 2011 (increase of 0.9
percentage points), the U.S. R&E credit being a larger percentage of consolidated earnings before
income taxes in 2011 (decrease of 0.2 percentage points), and a variety of other factors (increase of
0.1 percentage points).
The 2.7 percentage point decrease of the effective tax rate from 2009 to 2010 was due to the reversal
of previously accrued taxes in 2010 (decrease of 2.5 percentage points), a geographic shift in earnings
toward lower tax jurisdictions in 2010 (decrease of 0.8 percentage points), the U.S. research and
experimentation (“R&E”) credit being a smaller percentage of consolidated earnings before income
taxes in 2010 (increase of 1.4 percentage points), and a variety of other factors (decrease of 0.8
percentage points).
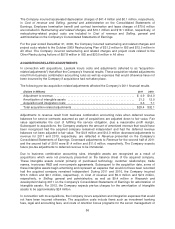
Net Earnings and Earnings per Share
The following table summarizes net earnings and basic and diluted net earnings per share:
(Dollars in millions, except per share amounts) 2011 2010 2009
Net Earnings .................................................. $320.9 $340.0 $145.9
Basic earnings per share ........................................ $ 4.16 $ 4.33 $ 1.87
Diluted earnings per share ....................................... $ 4.12 $ 4.28 $ 1.86
Net earnings for the year ended December 31, 2011 decreased 6% from the prior year primarily due to
an increase in the effective tax rate as well as lower operating income and higher net interest expense.
For 2011, the YTY decreases in basic and diluted earnings per share were primarily attributable to
decreased earnings offset partially by the decreases in the average number of shares outstanding, due
to the Company’s stock repurchases.
Net earnings for the year ended December 31, 2010 increased 133% from the prior year primarily due
to higher operating income. The higher operating income versus 2009 was due to good revenue
growth and stronger gross profit margins, which also benefited from a reduced net impact of
restructuring costs and acquisition-related adjustments. For the year ended December 31, 2010, the
increases in basic and diluted net earnings per share YTY were primarily attributable to increased net
earnings.
Natural Disasters in Japan and Thailand
On March 11, 2011, northeastern Japan experienced a devastating earthquake and tsunami off of the
Pacific coast. These events have had a significant negative impact on the Japanese economy.
Although the Company did not experience any significant damage to its products or other assets, the
Company’s supply chain was impacted, as a number of technology components are sourced from
suppliers in northern Japan. However, the Company has identified and implemented alternative
sources. For 2011, the Company experienced a limited impact on hardware availability and incurred
52