Lexmark 2010 Annual Report Download - page 99
Download and view the complete annual report
Please find page 99 of the 2010 Lexmark annual report below. You can navigate through the pages in the report by either clicking on the pages listed below, or by using the keyword search tool below to find specific information within the annual report.-
 1
1 -
2
-
3
-
4
-
5
-
6
-
7
-
8
-
9
-
10
-
11
-
12
-
13
-
14
-
15
-
16
-
17
-
18
-
19
-
20
-
21
-
22
-
23
-
24
-
25
-
26
-
27
-
28
-
29
-
30
-
31
-
32
-
33
-
34
-
35
-
36
-
37
-
38
-
39
-
40
-
41
-
42
-
43
-
44
-
45
-
46
-
47
-
48
-
49
-
50
-
51
-
52
-
53
-
54
-
55
-
56
-
57
-
58
-
59
-
60
-
61
-
62
-
63
-
64
-
65
-
66
-
67
-
68
-
69
-
70
-
71
-
72
-
73
-
74
-
75
-
76
-
77
-
78
-
79
-
80
-
81
-
82
-
83
-
84
-
85
-
86
-
87
-
88
-
 89
89 -
 90
90 -
 91
91 -
 92
92 -
 93
93 -
 94
94 -
 95
95 -
 96
96 -
 97
97 -
 98
98 -
 99
99 -
 100
100 -
 101
101 -
 102
102 -
 103
103 -
 104
104 -
 105
105 -
 106
106 -
 107
107 -
 108
108 -
 109
109 -
110
-
111
-
112
-
113
-
114
-
115
-
116
-
117
-
118
-
119
-
120
-
121
-
122
-
123
-
124
-
125
-
126
-
127
-
128
-
129
-
130
-
131
-
132
-
133
-
134
-
135
-
136
-
137
-
138
-
139
-
140
-
141
-
142
-
143
-
144
-
145
-
146
-
147
 |
 |

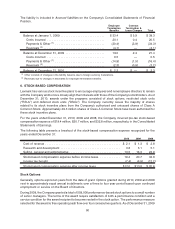
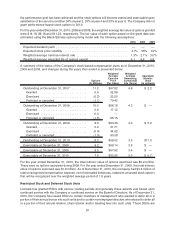
Company had $32.6 million of total unrecognized compensation expense, net of estimated forfeitures,
related to RSUs and DSUs that will be recognized over the weighted average period of 3.2 years.
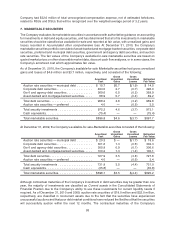
7. MARKETABLE SECURITIES
The Company evaluates its marketable securities in accordance with authoritative guidance on accounting
for investments in debt and equity securities, and has determined that all of its investments in marketable
securities should be classified as available-for-sale and reported at fair value, with unrealized gains and
losses recorded in Accumulated other comprehensive loss. At December 31, 2010, the Company’s
marketable securities portfolio consisted of asset-backed and mortgage-backed securities, corporate debt
securities, preferred and municipal debt securities, government and agency debt securities, and auction
rate securities. The fair values of the Company’s available-for-sale marketable securities are based on
quoted market prices or other observable market data, discount cash flow analyses, or in some cases, the
Company’s amortized cost which approximates fair value.
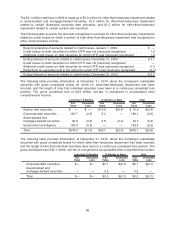
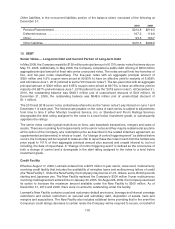
As of December 31, 2010, the Company’s available-for-sale Marketable securities had gross unrealized
gains and losses of $4.6 million and $3.7 million, respectively, and consisted of the following:
Amortized
Cost
Gross
Unrealized
Gains
Gross
Unrealized
Losses
Estimated
Fair Value
Auction rate securities — municipal debt . . . . . . . . . $ 15.7 $0.7 $(1.9) $ 14.5
Corporate debt securities . . . . . . . . . . . . . . . . . . . . . 494.0 2.7 (0.7) 496.0
Gov’t and agency debt securities . . . . . . . . . . . . . . . 369.6 0.5 (0.2) 369.9
Asset-backed and mortgage-backed securities. . . . . 88.9 0.7 (0.4) 89.2
Total debt securities . . . . . . . . . . . . . . . . . . . . . . . . . 968.2 4.6 (3.2) 969.6
Auction rate securities — preferred . . . . . . . . . . . . . 4.0 — (0.5) 3.5
Total security investments . . . . . . . . . . . . . . . . . . . . 972.2 4.6 (3.7) 973.1
Cash equivalents . . . . . . . . . . . . . . . . . . . . . . . . . . . (75.4) — — (75.4)
Total marketable securities. . . . . . . . . . . . . . . . . . . . $896.8 $4.6 $(3.7) $897.7
At December 31, 2009, the Company’s available-for-sale Marketable securities consisted of the following:
Amortized
Cost
Gross
Unrealized
Gains
Gross
Unrealized
Losses
Estimated
Fair Value
Auction rate securities — municipal debt . . . . . . . . . $ 20.3 $ — $(1.7) $ 18.6
Corporate debt securities . . . . . . . . . . . . . . . . . . . . . 301.6 1.3 (0.6) 302.3
Gov’t and agency debt securities . . . . . . . . . . . . . . . 305.8 0.9 (0.1) 306.6
Asset-backed and mortgage-backed securities. . . . . 100.2 1.3 (1.4) 100.1
Total debt securities . . . . . . . . . . . . . . . . . . . . . . . . . 727.9 3.5 (3.8) 727.6
Auction rate securities — preferred . . . . . . . . . . . . . 4.0 — (0.6) 3.4
Total security investments . . . . . . . . . . . . . . . . . . . . 731.9 3.5 (4.4) 731.0
Cash equivalents . . . . . . . . . . . . . . . . . . . . . . . . . . . (35.8) — — (35.8)
Total marketable securities. . . . . . . . . . . . . . . . . . . . $696.1 $3.5 $(4.4) $695.2
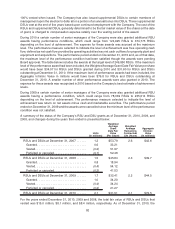
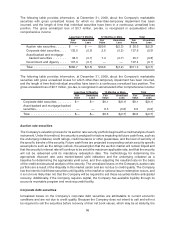
Although contractual maturities of the Company’s investment in debt securities may be greater than one
year, the majority of investments are classified as Current assets in the Consolidated Statements of
Financial Position due to the Company’s ability to use these investments for current liquidity needs if
required. As of December 31, 2010 and 2009, auction rate securities of $18.0 million and $22.0 million,
respectively, are classified in noncurrent assets due to the fact that the securities have experienced
unsuccessful auctions and that poor debt market conditions have reduced the likelihood that the securities
will successfully auction within the next 12 months. The contractual maturities of the Company’s
93