Lexmark 2010 Annual Report Download - page 57
Download and view the complete annual report
Please find page 57 of the 2010 Lexmark annual report below. You can navigate through the pages in the report by either clicking on the pages listed below, or by using the keyword search tool below to find specific information within the annual report.-
 1
1 -
2
-
3
-
4
-
5
-
6
-
7
-
8
-
9
-
10
-
11
-
12
-
13
-
14
-
15
-
16
-
17
-
18
-
19
-
20
-
21
-
22
-
23
-
24
-
25
-
26
-
27
-
28
-
29
-
30
-
31
-
32
-
33
-
34
-
35
-
36
-
37
-
38
-
39
-
40
-
41
-
42
-
43
-
44
-
45
-
46
-
 47
47 -
 48
48 -
 49
49 -
 50
50 -
 51
51 -
 52
52 -
 53
53 -
 54
54 -
 55
55 -
 56
56 -
 57
57 -
 58
58 -
 59
59 -
 60
60 -
 61
61 -
 62
62 -
 63
63 -
 64
64 -
 65
65 -
 66
66 -
 67
67 -
68
-
69
-
70
-
71
-
72
-
73
-
74
-
75
-
76
-
77
-
78
-
79
-
80
-
81
-
82
-
83
-
84
-
85
-
86
-
87
-
88
-
89
-
90
-
91
-
92
-
93
-
94
-
95
-
96
-
97
-
98
-
99
-
100
-
101
-
102
-
103
-
104
-
105
-
106
-
107
-
108
-
109
-
110
-
111
-
112
-
113
-
114
-
115
-
116
-
117
-
118
-
119
-
120
-
121
-
122
-
123
-
124
-
125
-
126
-
127
-
128
-
129
-
130
-
131
-
132
-
133
-
134
-
135
-
136
-
137
-
138
-
139
-
140
-
141
-
142
-
143
-
144
-
145
-
146
-
147
 |
 |

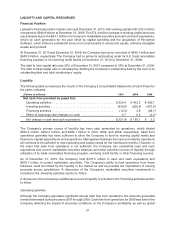
LIQUIDITY AND CAPITAL RESOURCES
Financial Position
Lexmark’s financial position remains strong at December 31, 2010, with working capital of $1,023.3 million
compared to $948.9 million at December 31, 2009. The $74.4 million increase in working capital accounts
was primarily due to the $84.7 million net increase in marketable securities and cash and cash equivalents,
driven by cash generation for the year offset by capital spending and the acquisition of Perceptive
Software, which shifted a substantial amount of current assets to noncurrent assets, primarily intangible
assets and goodwill.
At December 31, 2010 and December 31, 2009, the Company had senior note debt of $649.1 million and
$648.9 million, respectively. The Company had no amounts outstanding under its U.S. trade receivables
financing program or its revolving credit facility at December 31, 2010 or December 31, 2009.
The debt to total capital ratio was 32% at December 31, 2010 compared to 39% at December 31, 2009.
The debt to total capital ratio is calculated by dividing the Company’s outstanding debt by the sum of its
outstanding debt and total stockholders’ equity.
Liquidity
The following table summarizes the results of the Company’s Consolidated Statements of Cash Flows for
the years indicated:
(Dollars in millions) 2010 2009 2008
Net cash flow provided by (used for):
Operating activities . . . . . . . . . . . . . . . . . . . . . . . . . . . . . . . . . . . . $ 520.4 $ 402.2 $ 482.1
Investing activities . . . . . . . . . . . . . . . . . . . . . . . . . . . . . . . . . . . . . (630.6) (228.2) (427.6)
Financing activities . . . . . . . . . . . . . . . . . . . . . . . . . . . . . . . . . . . . (12.3) 3.8 (48.1)
Effect of exchange rate changes on cash . . . . . . . . . . . . . . . . . . . 0.7 2.3 (4.2)
Net change in cash and cash equivalents . . . . . . . . . . . . . . . . . . . $(121.8) $ 180.1 $ 2.2
The Company’s primary source of liquidity has been cash generated by operations, which totaled
$520.4 million, $402.2 million, and $482.1 million in 2010, 2009, and 2008, respectively. Cash from
operations generally has been sufficient to allow the Company to fund its working capital needs and
finance its capital expenditures and acquisitions. Management believes that cash provided by operations
will continue to be sufficient to meet operating and capital needs for the next twelve months. However, in
the event that cash from operations is not sufficient, the Company has substantial cash and cash
equivalents and current marketable securities balances and other potential sources of liquidity through
utilization of its trade receivables financing program, revolving credit facility or other financing sources.
As of December 31, 2010, the Company held $337.5 million in cash and cash equivalents and
$879.7 million in current marketable securities. The Company’s ability to fund operations from these
balances could be limited by the liquidity in the market as well as possible tax implications of moving
proceeds across jurisdictions. A discussion of the Company’s marketable securities investments is
included in the Investing activities section to follow.
A discussion of the Company’s additional sources of liquidity is included in the Financing activities section
to follow.
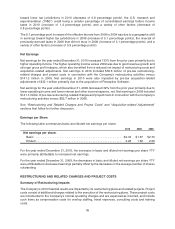
Operating activities
Although the Company generates significant annual cash flow from operations, the amounts generated
trended downward during the years 2007 through 2009. Cash flow from operations for 2009 was low for the
Company reflecting the impact of economic conditions on the Company’s profitability as well as global
51