Lexmark 2010 Annual Report Download - page 68
Download and view the complete annual report
Please find page 68 of the 2010 Lexmark annual report below. You can navigate through the pages in the report by either clicking on the pages listed below, or by using the keyword search tool below to find specific information within the annual report.-
 1
1 -
2
-
3
-
4
-
5
-
6
-
7
-
8
-
9
-
10
-
11
-
12
-
13
-
14
-
15
-
16
-
17
-
18
-
19
-
20
-
21
-
22
-
23
-
24
-
25
-
26
-
27
-
28
-
29
-
30
-
31
-
32
-
33
-
34
-
35
-
36
-
37
-
38
-
39
-
40
-
41
-
42
-
43
-
44
-
45
-
46
-
47
-
48
-
49
-
50
-
51
-
52
-
53
-
54
-
55
-
56
-
57
-
 58
58 -
 59
59 -
 60
60 -
 61
61 -
 62
62 -
 63
63 -
 64
64 -
 65
65 -
 66
66 -
 67
67 -
 68
68 -
 69
69 -
 70
70 -
 71
71 -
 72
72 -
 73
73 -
 74
74 -
 75
75 -
 76
76 -
 77
77 -
 78
78 -
79
-
80
-
81
-
82
-
83
-
84
-
85
-
86
-
87
-
88
-
89
-
90
-
91
-
92
-
93
-
94
-
95
-
96
-
97
-
98
-
99
-
100
-
101
-
102
-
103
-
104
-
105
-
106
-
107
-
108
-
109
-
110
-
111
-
112
-
113
-
114
-
115
-
116
-
117
-
118
-
119
-
120
-
121
-
122
-
123
-
124
-
125
-
126
-
127
-
128
-
129
-
130
-
131
-
132
-
133
-
134
-
135
-
136
-
137
-
138
-
139
-
140
-
141
-
142
-
143
-
144
-
145
-
146
-
147
 |
 |

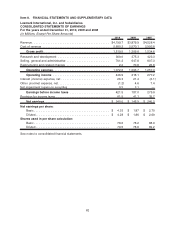
Item 8. FINANCIAL STATEMENTS AND SUPPLEMENTARY DATA
Lexmark International, Inc. and Subsidiaries
CONSOLIDATED STATEMENTS OF EARNINGS
For the years ended December 31, 2010, 2009 and 2008
(In Millions, Except Per Share Amounts)
2010 2009 2008
Revenue . . . . . . . . . . . . . . . . . . . . . . . . . . . . . . . . . . . . . . . . . . . . . $4,199.7 $3,879.9 $4,528.4
Cost of revenue . . . . . . . . . . . . . . . . . . . . . . . . . . . . . . . . . . . . . . . 2,680.2 2,570.1 2,993.8
Gross profit . . . . . . . . . . . . . . . . . . . . . . . . . . . . . . . . . . . . . . 1,519.5 1,309.8 1,534.6
Research and development . . . . . . . . . . . . . . . . . . . . . . . . . . . . . . 369.0 375.3 423.3
Selling, general and administrative . . . . . . . . . . . . . . . . . . . . . . . . . 701.2 647.8 807.3
Restructuring and related charges . . . . . . . . . . . . . . . . . . . . . . . . . 2.4 70.6 26.8
Operating expense. . . . . . . . . . . . . . . . . . . . . . . . . . . . . . . . . 1,072.6 1,093.7 1,257.4
Operating income . . . . . . . . . . . . . . . . . . . . . . . . . . . . . . . . . 446.9 216.1 277.2
Interest (income) expense, net . . . . . . . . . . . . . . . . . . . . . . . . . . . . 26.3 21.4 (6.1)
Other (income) expense, net. . . . . . . . . . . . . . . . . . . . . . . . . . . . . . (1.2) 4.6 7.4
Net impairment losses on securities . . . . . . . . . . . . . . . . . . . . . . . . 0.3 3.1 —
Earnings before income taxes . . . . . . . . . . . . . . . . . . . . . . . 421.5 187.0 275.9
Provision for income taxes . . . . . . . . . . . . . . . . . . . . . . . . . . . . . . . 81.5 41.1 35.7
Net earnings. . . . . . . . . . . . . . . . . . . . . . . . . . . . . . . . . . . . . . $ 340.0 $ 145.9 $ 240.2
Net earnings per share:
Basic . . . . . . . . . . . . . . . . . . . . . . . . . . . . . . . . . . . . . . . . . . . . $ 4.33 $ 1.87 $ 2.70
Diluted........................................... $ 4.28 $ 1.86 $ 2.69
Shares used in per share calculation:
Basic . . . . . . . . . . . . . . . . . . . . . . . . . . . . . . . . . . . . . . . . . . . . 78.6 78.2 88.9
Diluted........................................... 79.5 78.6 89.2
See notes to consolidated financial statements.
62