Lexmark 2010 Annual Report Download - page 45
Download and view the complete annual report
Please find page 45 of the 2010 Lexmark annual report below. You can navigate through the pages in the report by either clicking on the pages listed below, or by using the keyword search tool below to find specific information within the annual report.-
 1
1 -
2
-
3
-
4
-
5
-
6
-
7
-
8
-
9
-
10
-
11
-
12
-
13
-
14
-
15
-
16
-
17
-
18
-
19
-
20
-
21
-
22
-
23
-
24
-
25
-
26
-
27
-
28
-
29
-
30
-
31
-
32
-
33
-
34
-
 35
35 -
 36
36 -
 37
37 -
 38
38 -
 39
39 -
 40
40 -
 41
41 -
 42
42 -
 43
43 -
 44
44 -
 45
45 -
 46
46 -
 47
47 -
 48
48 -
 49
49 -
 50
50 -
 51
51 -
 52
52 -
 53
53 -
 54
54 -
 55
55 -
56
-
57
-
58
-
59
-
60
-
61
-
62
-
63
-
64
-
65
-
66
-
67
-
68
-
69
-
70
-
71
-
72
-
73
-
74
-
75
-
76
-
77
-
78
-
79
-
80
-
81
-
82
-
83
-
84
-
85
-
86
-
87
-
88
-
89
-
90
-
91
-
92
-
93
-
94
-
95
-
96
-
97
-
98
-
99
-
100
-
101
-
102
-
103
-
104
-
105
-
106
-
107
-
108
-
109
-
110
-
111
-
112
-
113
-
114
-
115
-
116
-
117
-
118
-
119
-
120
-
121
-
122
-
123
-
124
-
125
-
126
-
127
-
128
-
129
-
130
-
131
-
132
-
133
-
134
-
135
-
136
-
137
-
138
-
139
-
140
-
141
-
142
-
143
-
144
-
145
-
146
-
147
 |
 |

2010 Business Factors
The Company exited the 2009 downturn with a strong portfolio of products and solutions as well as with a
reduced base of operating costs and expenses due to restructuring initiatives conducted in 2009 and
before. As a consequence, the revenue growth experienced by the Company in 2010 resulted in
improvement in its operating margin. The Company also continued to execute on its strategic focus on
workgroup laser hardware devices and higher performance and priced inkjet hardware devices, focused
on business users. In 2010, the Company saw good growth in laser hardware unit sales, due to strong
growth in laser workgroup hardware unit sales. Inkjet hardware unit sales declined in 2010, as the growth
the Company experienced in business focused inkjet unit sales was more than offset by declines in lower
performance and lower priced consumer inkjets. The Company also saw growth in revenue from the sale
of supplies, as growth in sales of laser supplies more than offset declining revenue in inkjet supplies. The
new laser and inkjet product introductions in 2010 have continued to strengthen the breadth and depth of
the Company’s workgroup lasers, color lasers, laser MFPs, and business inkjets.
To allow Lexmark to participate in the growing market to manage unstructured data and processes, and to
build upon and strengthen the current industry-focused document workflow solutions and managed print
services, the Company acquired Perceptive Software in the second quarter of 2010.
ISS
During 2010, Lexmark continued its investments in ISS, focusing on continuing to broaden its line of mono
and color printers and multifunction products, and solutions and service offerings, targeting the higher
usage segments of the imaging market.
• Laser workgroup products and MFPs as well as managed print services experienced double-digit
growth in revenue.
• Inkjet hardware sales declined in 2010, as the growth the Company experienced in business
focused inkjet hardware sales was more than offset by declines in lower performance and lower
priced consumer inkjets.
• Industry recognition and awards for both the laser products and high-end inkjet continue to illustrate
the success of Lexmark’s R&D investments.
Perceptive Software
Lexmark acquired Perceptive Software on June 7, 2010. Since the acquisition the focus of Perceptive
Software has been to continue to accelerate the development of new ECM and workflow software
products, and leverage the domestic and global infrastructure of Lexmark to expand the industries and
geographic regions in which Perceptive participates. The goal of these investments is to continue to grow
Perceptive revenue and accelerate growth in international markets.
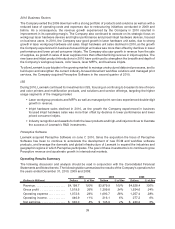
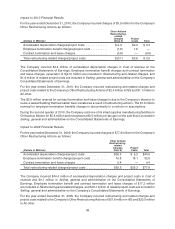
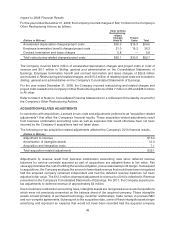
Operating Results Summary
The following discussion and analysis should be read in conjunction with the Consolidated Financial
Statements and Notes thereto. The following table summarizes the results of the Company’s operations for
the years ended December 31, 2010, 2009 and 2008:
(Dollars in Millions) Dollars % of Rev Dollars % of Rev Dollars %ofRev
2010 2009 2008
Revenue. . . . . . . . . . . . . . . . . . $4,199.7 100% $3,879.9 100% $4,528.4 100%
Gross profit . . . . . . . . . . . . . . . 1,519.5 36% 1,309.8 34% 1,534.6 34%
Operating expense . . . . . . . . . . 1,072.6 26% 1,093.7 28% 1,257.4 28%
Operating income . . . . . . . . . . . 446.9 11% 216.1 6% 277.2 6%
Net earnings. . . . . . . . . . . . . . . $ 340.0 8% $ 145.9 4% $ 240.2 5%
39