Lexmark 2010 Annual Report Download - page 121
Download and view the complete annual report
Please find page 121 of the 2010 Lexmark annual report below. You can navigate through the pages in the report by either clicking on the pages listed below, or by using the keyword search tool below to find specific information within the annual report.-
 1
1 -
2
-
3
-
4
-
5
-
6
-
7
-
8
-
9
-
10
-
11
-
12
-
13
-
14
-
15
-
16
-
17
-
18
-
19
-
20
-
21
-
22
-
23
-
24
-
25
-
26
-
27
-
28
-
29
-
30
-
31
-
32
-
33
-
34
-
35
-
36
-
37
-
38
-
39
-
40
-
41
-
42
-
43
-
44
-
45
-
46
-
47
-
48
-
49
-
50
-
51
-
52
-
53
-
54
-
55
-
56
-
57
-
58
-
59
-
60
-
61
-
62
-
63
-
64
-
65
-
66
-
67
-
68
-
69
-
70
-
71
-
72
-
73
-
74
-
75
-
76
-
77
-
78
-
79
-
80
-
81
-
82
-
83
-
84
-
85
-
86
-
87
-
88
-
89
-
90
-
91
-
92
-
93
-
94
-
95
-
96
-
97
-
98
-
99
-
100
-
101
-
102
-
103
-
104
-
105
-
106
-
107
-
108
-
109
-
110
-
 111
111 -
 112
112 -
 113
113 -
 114
114 -
 115
115 -
 116
116 -
 117
117 -
 118
118 -
 119
119 -
 120
120 -
 121
121 -
 122
122 -
 123
123 -
 124
124 -
 125
125 -
 126
126 -
 127
127 -
 128
128 -
 129
129 -
 130
130 -
 131
131 -
132
-
133
-
134
-
135
-
136
-
137
-
138
-
139
-
140
-
141
-
142
-
143
-
144
-
145
-
146
-
147
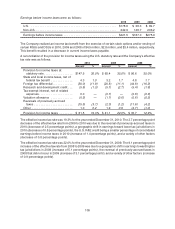
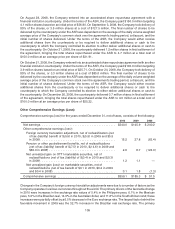
 |
 |

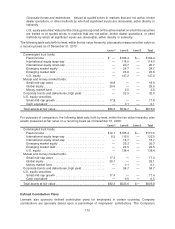
Corporate bonds and debentures: Valued at quoted prices in markets that are not active, broker
dealer quotations, or other methods by which all significant inputs are observable, either directly or
indirectly.
U.S. equity securities: Valued at the closing price reported on the active market on which the securities
are traded or at quoted prices in markets that are not active, broker dealer quotations, or other
methods by which all significant inputs are observable, either directly or indirectly.
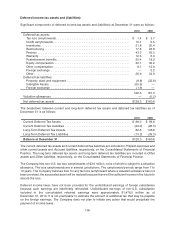
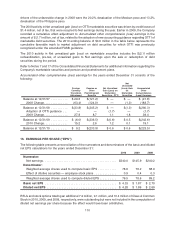
The following table sets forth by level, within the fair value hierarchy, plan assets measured at fair value on
a recurring basis as of December 31, 2010:
Level 1 Level 2 Level 3 Total
Commingled trust funds:
Fixed income . . . . . . . . . . . . . . . . . . . . . . . . . . . . . . . . . . . $ — $184.4 $— $184.4
International equity large-cap . . . . . . . . . . . . . . . . . . . . . . . — 114.0 — 114.0
International equity small-cap . . . . . . . . . . . . . . . . . . . . . . . — 20.7 — 20.7
Emerging market equity . . . . . . . . . . . . . . . . . . . . . . . . . . . — 24.7 — 24.7
Emerging market debt. . . . . . . . . . . . . . . . . . . . . . . . . . . . . — 23.6 — 23.6
U.S. equity . . . . . . . . . . . . . . . . . . . . . . . . . . . . . . . . . . . . . — 147.2 — 147.2
Mutual and money market funds:
Small mid-cap value . . . . . . . . . . . . . . . . . . . . . . . . . . . . . . 18.9 — — 18.9
Global equity. . . . . . . . . . . . . . . . . . . . . . . . . . . . . . . . . . . . 29.6 — — 29.6
Money market fund . . . . . . . . . . . . . . . . . . . . . . . . . . . . . . . — 2.5 — 2.5
Corporate bonds and debentures, high yield. . . . . . . . . . . . . . — 32.5 — 32.5
U.S. equity securities:
Small mid-cap growth . . . . . . . . . . . . . . . . . . . . . . . . . . . . . 17.8 — — 17.8
Cash equivalent . . . . . . . . . . . . . . . . . . . . . . . . . . . . . . . . . — 0.1 — 0.1
Total assets at fair value. . . . . . . . . . . . . . . . . . . . . . . . . . . . . $66.3 $549.7 $— $616.0
For purposes of comparison, the following table sets forth by level, within the fair value hierarchy, plan
assets measured at fair value on a recurring basis as of December 31, 2009:
Level 1 Level 2 Level 3 Total
Commingled trust funds:
Fixed income . . . . . . . . . . . . . . . . . . . . . . . . . . . . . . . . . . . $12.1 $165.4 $— $177.5
International equity large-cap . . . . . . . . . . . . . . . . . . . . . . . 6.5 116.0 — 122.5
International equity small-cap . . . . . . . . . . . . . . . . . . . . . . . — 18.7 — 18.7
Emerging market equity . . . . . . . . . . . . . . . . . . . . . . . . . . . — 25.3 — 25.3
Emerging market debt. . . . . . . . . . . . . . . . . . . . . . . . . . . . . — 24.5 — 24.5
U.S. equity . . . . . . . . . . . . . . . . . . . . . . . . . . . . . . . . . . . . . — 138.4 — 138.4
Mutual and money market funds:
Small mid-cap value . . . . . . . . . . . . . . . . . . . . . . . . . . . . . . 17.2 — — 17.2
Global equity. . . . . . . . . . . . . . . . . . . . . . . . . . . . . . . . . . . . 29.1 — — 29.1
Money market fund . . . . . . . . . . . . . . . . . . . . . . . . . . . . . . . — 0.1 — 0.1
Corporate bonds and debentures, high yield. . . . . . . . . . . . . . — 34.7 — 34.7
U.S. equity securities:
Small mid-cap growth . . . . . . . . . . . . . . . . . . . . . . . . . . . . . 17.4 — — 17.4
Cash equivalent . . . . . . . . . . . . . . . . . . . . . . . . . . . . . . . . . — 0.5 — 0.5
Total assets at fair value. . . . . . . . . . . . . . . . . . . . . . . . . . . . . $82.3 $523.6 $— $605.9
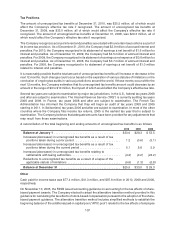
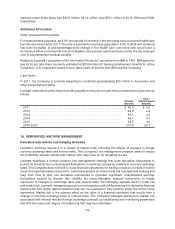
Defined Contribution Plans
Lexmark also sponsors defined contribution plans for employees in certain countries. Company
contributions are generally based upon a percentage of employees’ contributions. The Company’s
115