Lexmark 2010 Annual Report Download - page 32
Download and view the complete annual report
Please find page 32 of the 2010 Lexmark annual report below. You can navigate through the pages in the report by either clicking on the pages listed below, or by using the keyword search tool below to find specific information within the annual report.-
 1
1 -
2
-
3
-
4
-
5
-
6
-
7
-
8
-
9
-
10
-
11
-
12
-
13
-
14
-
15
-
16
-
17
-
18
-
19
-
20
-
21
-
 22
22 -
 23
23 -
 24
24 -
 25
25 -
 26
26 -
 27
27 -
 28
28 -
 29
29 -
 30
30 -
 31
31 -
 32
32 -
 33
33 -
 34
34 -
 35
35 -
 36
36 -
 37
37 -
 38
38 -
 39
39 -
 40
40 -
 41
41 -
 42
42 -
43
-
44
-
45
-
46
-
47
-
48
-
49
-
50
-
51
-
52
-
53
-
54
-
55
-
56
-
57
-
58
-
59
-
60
-
61
-
62
-
63
-
64
-
65
-
66
-
67
-
68
-
69
-
70
-
71
-
72
-
73
-
74
-
75
-
76
-
77
-
78
-
79
-
80
-
81
-
82
-
83
-
84
-
85
-
86
-
87
-
88
-
89
-
90
-
91
-
92
-
93
-
94
-
95
-
96
-
97
-
98
-
99
-
100
-
101
-
102
-
103
-
104
-
105
-
106
-
107
-
108
-
109
-
110
-
111
-
112
-
113
-
114
-
115
-
116
-
117
-
118
-
119
-
120
-
121
-
122
-
123
-
124
-
125
-
126
-
127
-
128
-
129
-
130
-
131
-
132
-
133
-
134
-
135
-
136
-
137
-
138
-
139
-
140
-
141
-
142
-
143
-
144
-
145
-
146
-
147
 |
 |
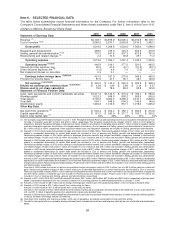
Item 6. SELECTED FINANCIAL DATA
The table below summarizes recent financial information for the Company. For further information refer to the
Company’s Consolidated Financial Statements and Notes thereto presented under Part II, Item 8 of this Form 10-K.
(Dollars in Millions, Except per Share Data)
2010 2009 2008 2007 2006
Statement of Earnings Data:
Revenue
(1)
................................... $4,199.7 $3,879.9 $4,528.4 $4,973.9 $5,108.1
Cost of revenue
(1)(2)
............................ 2,680.2 2,570.1 2,993.8 3,410.3 3,462.1
Gross profit ............................... 1,519.5 1,309.8 1,534.6 1,563.6 1,646.0
Research and development ........................ 369.0 375.3 423.3 403.8 370.5
Selling, general and administrative
(1)(2)
............... 701.2 647.8 807.3 812.8 761.8
Restructuring and related charges
(2)
................. 2.4 70.6 26.8 25.7 71.2
Operating expense.......................... 1,072.6 1,093.7 1,257.4 1,242.3 1,203.5
Operating income
(1)(2)(3)
..................... 446.9 216.1 277.2 321.3 442.5
Interest (income) expense, net...................... 26.3 21.4 (6.1) (21.2) (22.1)
Other (income) expense, net
(4)
..................... (1.2) 4.6 7.4 (7.0) 5.3
Net impairment losses on securities . . . ............... 0.3 3.1 — — —
Earnings before income taxes
(1)(2)(3)(4)
........... 421.5 187.0 275.9 349.5 459.3
Provision for income taxes
(5)
...................... 81.5 41.1 35.7 48.7 120.9
Net earnings
(1)(2)(3)(4)(5)
...................... $ 340.0 $ 145.9 $ 240.2 $ 300.8 $ 338.4
Diluted net earnings per common share
(1)(2)(3)(4)(5)
..... $ 4.28 $ 1.86 $ 2.69 $ 3.14 $ 3.27
Shares used in per share calculation ............... 79.5 78.6 89.2 95.8 103.5
Statement of Financial Position Data:
Cash, cash equivalents and current marketable securities . . . $1,217.2 $1,132.5 $ 973.3 $ 796.1 $ 550.9
Workingcapital................................ 1,023.3 948.9 805.2 569.5 506.0
Total assets ................................... 3,705.2 3,354.2 3,265.4 3,121.1 2,849.0
Total debt .................................... 649.1 648.9 654.2 149.9 149.8
Stockholders’ equity . . . .......................... 1,394.3 1,013.6 812.1 1,278.3 1,035.2
Other Key Data:
Net cash from operations
(6)
....................... $ 520.4 $ 402.2 $ 482.1 $ 564.2 $ 670.9
Capital expenditures. . . .......................... $ 161.2 $ 242.0 $ 217.7 $ 182.7 $ 200.2
Debt to total capital ratio
(7)
........................ 32% 39% 45% 10% 13%
(1) The Company acquired Perceptive Software on June 7, 2010. Perceptive Software Revenue and Operating income (loss) included in the table above from
the date of acquisition were $37.3 million and $(16.1) million, respectively. The Company incurred pre-tax charges of $19.1 million in 2010 related to
acquisitions, primarily Perceptive Software, including $12.0 million related to amortization of intangible assets and $7.1 million of other acquisition-related
costs and integration expenses. Amortization of intangible assets is included in Cost of revenue and Selling, general and administrative in the amount of
$9.1 million and $2.9 million, respectively. Other acquisition-related costs and integration expenses are included in Selling, general and administrative.
(2) Amounts in 2010 include restructuring-related charges and project costs of $38.6 million. Restructuring-related charges of $4.1 million and $1.8 million
relatedtoaccelerateddepreciationoncertainfixedassetsareincludedinCost of revenue and Selling, general and administrative, respectively.
Restructuring-related charges of $2.4 million relating to employee termination benefits and contract termination charges are included in Restructuring
and related charges. Project costs of $13.3 million are included in Cost of revenue, and $17.0 million are included in Selling, general and administrative.
Amounts in 2009 include restructuring-related charges and project costs of $141.3 million. Restructuring-related charges of $41.4 million and $0.1 million
relatedtoaccelerateddepreciationoncertainfixedassetsareincludedinCost of revenue and Selling, general and administrative, respectively.
Restructuring-related charges of $70.6 million relating to employee termination benefits and contract termination charges are included in Restructuring
and related charges. Project costs of $10.1 million are included in Cost of revenue, and $19.1 million are included in Selling, general and administrative.
Amounts in 2008 include restructuring-related charges and project costs of $92.7 million. Restructuring-related charges of $27.2 million and $8.1 million
relatedtoaccelerateddepreciationoncertainfixedassetsareincludedinCost of revenue and Selling, general and administrative, respectively.
Restructuring-related charges of $26.8 million relating to employee termination benefits and contract termination charges are included in Restructuring
and related charges. Project costs of $15.3 million are included in Cost of revenue, and $15.3 million are included in Selling, general and administrative.
Amounts in 2007 include restructuring-related charges and project costs of $52.0 million. Restructuring-related charges of $5.1 million relating to accelerated
depreciation on certain fixed assets are included in Cost of revenue. Restructuring-related charges of $25.7 million relating to employee termination benefit
charges are included in Restructuring and related charges. Project costs of $11.9 million and $9.3 million are included in Cost of revenue and Selling, general
and administrative, respectively.
Amounts in 2006 include the impact of restructuring-related charges and project costs of $125.2 million (net of a $9.9 million pension curtailment
gain). Restructuring-related charges of $40.0 million relating to accelerated depreciation on certain fixed assets are included in Cost of revenue.
Restructuring-related charges of $81.1 million relating to employee termination benefits and contract termination and lease termination charges and
the $9.9 million pension curtailment gain are included in Restructuring and related charges. Project costs of $2.1 million and $11.9 million are
included in Cost of revenue and Selling, general and administrative, respectively.
(3) Amounts in 2010, 2009, 2008, 2007 and 2006 include $19.4 million, $20.7 million, $32.8 million, $41.3 million and $43.2 million, respectively, of pre-tax stock-
based compensation expense due to the Company’s adoption of accounting guidance for share-based payments on January 1, 2006.
(4) Amounts in 2007 include an $8.1 million pre-tax foreign exchange gain realized upon the substantial liquidation of the Company’s Scotland entity.
(5) Amounts in 2010 include a $14.7 million benefit from nonrecurring tax items.
Amounts in 2008 include an $11.6 million benefit from nonrecurring tax items.
Amounts in 2007 include an $18.4 million benefit from the reversal of previously accrued taxes primarily related to the settlement of a tax audit outside the
U.S. and $11.2 million of benefits resulting from adjustments to previously recorded taxes.
Amounts in 2006 include a $14.3 million benefit from the reversal of previously accrued taxes related to the finalization of certain tax audits and the expiration
of various domestic and foreign statutes of limitations.
(6) Cash flows from investing and financing activities, which are not presented, are integral components of total cash flow activity.
(7) The debt to total capital ratio is computed by dividing total debt (which includes both short-term and long-term debt) by the sum of total debt and stockholders’
equity.
26