Lexmark 2010 Annual Report Download - page 58
Download and view the complete annual report
Please find page 58 of the 2010 Lexmark annual report below. You can navigate through the pages in the report by either clicking on the pages listed below, or by using the keyword search tool below to find specific information within the annual report.-
 1
1 -
2
-
3
-
4
-
5
-
6
-
7
-
8
-
9
-
10
-
11
-
12
-
13
-
14
-
15
-
16
-
17
-
18
-
19
-
20
-
21
-
22
-
23
-
24
-
25
-
26
-
27
-
28
-
29
-
30
-
31
-
32
-
33
-
34
-
35
-
36
-
37
-
38
-
39
-
40
-
41
-
42
-
43
-
44
-
45
-
46
-
47
-
 48
48 -
 49
49 -
 50
50 -
 51
51 -
 52
52 -
 53
53 -
 54
54 -
 55
55 -
 56
56 -
 57
57 -
 58
58 -
 59
59 -
 60
60 -
 61
61 -
 62
62 -
 63
63 -
 64
64 -
 65
65 -
 66
66 -
 67
67 -
 68
68 -
69
-
70
-
71
-
72
-
73
-
74
-
75
-
76
-
77
-
78
-
79
-
80
-
81
-
82
-
83
-
84
-
85
-
86
-
87
-
88
-
89
-
90
-
91
-
92
-
93
-
94
-
95
-
96
-
97
-
98
-
99
-
100
-
101
-
102
-
103
-
104
-
105
-
106
-
107
-
108
-
109
-
110
-
111
-
112
-
113
-
114
-
115
-
116
-
117
-
118
-
119
-
120
-
121
-
122
-
123
-
124
-
125
-
126
-
127
-
128
-
129
-
130
-
131
-
132
-
133
-
134
-
135
-
136
-
137
-
138
-
139
-
140
-
141
-
142
-
143
-
144
-
145
-
146
-
147
 |
 |
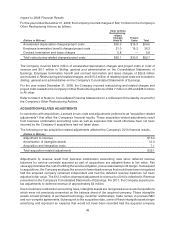
pension contributions made during the period. However, earnings and cash flows for 2010 showed a
significant increase from that of 2009.
The $118.2 million increase in cash flow from operating activities from 2009 to 2010 was driven by the
following factors.
Net earnings increased $194.1 million for 2010 as compared to 2009. The non-cash adjustment for
depreciation and amortization decreased $15.8 million YTY driven by the decrease in accelerated
depreciation in 2010 related to the Company’s restructuring actions.
Accounts payable increased $22.7 million in 2010 and decreased $47.8 million in 2009. The $70.5 million
fluctuation between the activity in 2010 and that of 2009 is primarily driven by greater demand in 2010
coupled with a longer payment cycle. Furthermore, the year-end Accounts payable balance was
considerably higher at December 31, 2008 compared to December 31, 2009 and is a significant factor
in the Company’s 2009 and 2010 cash flows, respectively.
The activities above were partially offset by the following factors.
Inventories balances increased $8.8 million in 2010 and decreased $81.2 million in 2009. The $90.0 million
fluctuation between the activity in 2010 and that of 2009 is primarily due to actions taken by the Company in
2009 in response to challenging economic conditions that negatively impacted the Company at that time.
See discussion of prior year cash flows from operating activities for additional information.
Trade receivables balances increased $28.5 million in 2010 (excluding receivables recognized on the date
of acquisition of Perceptive Software) and decreased $2.3 million in 2009. The $30.8 million fluctuation
between the activity in 2010 and that of 2009 is primarily driven by the increase in revenues in the fourth
quarter of 2010 compared to the fourth quarter of 2009. The increase in the Company’s days of sales
outstanding at year end 2010 was largely due to the timing of sales as indicated by the slight improvement
in delinquent receivables at year end 2010 compared to year end 2009.
The net decrease in Accrued liabilities and Other assets and liabilities, collectively, was $4.7 million less in
2010 compared to that of 2009. The fluctuation between the activity in 2010 and that of 2009 was the result
of various offsetting factors, including both cash transactions as well as the effect of accruals of expected
future operating cash receipts and payments. Notable fluctuations in cash transactions included pension
funding and cash paid for income taxes. The Company made $92.4 million of pension and postretirement
payments in 2009, driven by the steep decline in the fair value of pension plan assets in late 2008,
compared to only $8.7 million in 2010. Cash paid for income taxes, net of refunds, was $77.4 million in 2010
compared to $41.3 million in 2009.
Refer to the contractual cash obligations in the pages that follow for additional information regarding items
that will likely impact the Company’s future cash flows.
The $79.9 million decrease in cash flows from operating activities from 2008 to 2009 was driven by the
following factors.
The decrease in Trade receivables was $148.2 million less in 2009 compared to that of 2008. Trade
receivables decreased $150.5 million during 2008 compared to a decrease of only $2.3 million in 2009.
During 2008, collections performance and days of sales outstanding improved significantly, reducing the
trade receivables balance. During 2009, the Company maintained this improved performance in days of
sales outstanding, as indicated in the days of sales outstanding measurements included in the section to
follow.
Net earnings decreased $94.3 million for full year 2009 as compared to full year 2008. Challenging
economic conditions negatively impacted the Company’s profitability during the first part of 2009 as well as
the operating cash flows that were ultimately realized.
The activities above were partially offset by the following factors.
52